

A stock can look cheap because its price has fallen 40%, its P/E ratio is in the single digits, or it trades at a discount to competitors.
None of those facts proves that the stock is undervalued.
A useful Stock Valuation Checklist starts with the business rather than the multiple. Before deciding that a stock is cheap or genuinely undervalued, check whether its earnings are sustainable, whether those earnings turn into cash, whether debt creates financial pressure, whether shareholders are being diluted, and whether current profits are unusually high because of a business cycle.
Only after those questions should valuation move to the center of the analysis.
The guiding principle is simple:
Valuation comes last, not first.
A low multiple is not the conclusion. It is a reason to investigate.
How to Use This Stock Valuation Checklist
Before calling a stock cheap, work through these seven questions:
- Earnings: Are current profits sustainable?
- Free cash flow: Are reported earnings turning into cash?
- Balance sheet: Could debt or refinancing pressure the business?
- Dilution: Is value actually growing on a per-share basis?
- Cyclicality: Are current profits close to normal?
- Growth quality: Is growth improving profits and cash generation?
- Valuation: Does the stock still look attractive after the first six checks?
The order matters.
Starting with a low multiple can encourage confirmation bias. An investor sees a P/E of 8 and then starts searching for evidence that the stock must be undervalued.
A more disciplined question is:
Why does the market believe this stock deserves to be cheap?
If the reason appears temporary while the company’s long-term economics remain intact, the discount may deserve closer study.
If the discount reflects deteriorating earnings, weak cash conversion, excessive debt, dilution, or unsustainably high cyclical profits, the apparent bargain can disappear quickly.
Start With Earnings, Not the Stock Price
Suppose a stock falls from $100 to $60.
It is tempting to say that the stock is now 40% cheaper. Its price is certainly 40% lower, but its underlying value may also have changed.
Assume the company previously earned $5 per share but earnings later fall to $2 per share.
Before the decline:
P/E = $100 ÷ $5 = 20
After the decline:
P/E = $60 ÷ $2 = 30
The stock price fell sharply, yet the stock became more expensive relative to its earnings.
That is why the first question in a Stock Valuation Checklist should not be “How far has the stock fallen?”
It should be:
What happened to the company’s earnings power?
Earnings per share, or EPS, expresses a company’s earnings on a per-share basis. P/E then compares the share price with EPS. The SEC’s financial-statement guide explains both EPS and the basic P/E relationship.
SEC Beginners’ Guide to Financial Statements
For valuation analysis, one quarter is rarely enough. Look across multiple reporting periods and examine revenue, operating margins, operating income, net income, EPS, and management’s explanation for significant changes.
A low P/E becomes particularly questionable when the “E” in P/E is unusually high or likely to fall.
Check Whether Earnings Turn Into Free Cash Flow
Accounting profit matters, but a business also needs to generate cash. That is why free cash flow is an essential part of a Stock Valuation Checklist.
One common investor calculation for free cash flow, or FCF, is:
Net cash from operating activities − capital expenditures
In practice, analysts may define free cash flow differently, so investors should check how a company or data provider calculates it.
The basic idea is still useful: how much cash is the business producing after the capital spending required to support its operations?
Consider two hypothetical companies:
| Metric | Company A | Company B |
|---|---|---|
| Net income | $500 million | $500 million |
| Operating cash flow | $550 million | $350 million |
| Capital expenditures | $150 million | $250 million |
| Approx. free cash flow | $400 million | $100 million |

Both companies report identical net income.
Their cash economics are very different.
The SEC explains that the income statement reports profit over a period, while the cash flow statement shows cash inflows and outflows and reconciles operating cash flow with reported net income.
That does not mean free cash flow should always equal or exceed net income. It often will not.
Instead, investigate whether reported earnings consistently translate into a reasonable level of cash generation.
A persistent gap may come from working-capital changes, heavy capital spending, acquisitions, noncash accounting items, or timing differences.
Some explanations are temporary or economically sensible. Others may indicate that accounting earnings make the business look stronger than its cash generation suggests.
That distinction matters when a stock looks cheap on P/E but much less attractive on free cash flow.
Examine the Balance Sheet Before Celebrating a Low Multiple
Two companies can trade at exactly the same P/E ratio while carrying very different financial risk.
Suppose both earn $1 billion annually and both trade at 10 times earnings.
Company A
- $5 billion in cash
- little debt
- modest interest expense
Company B
- $500 million in cash
- $8 billion in debt
- substantial interest expense
The same P/E does not make these companies equally cheap.
The SEC describes a balance sheet as a snapshot of a company’s assets, liabilities, and shareholders’ equity at a particular point in time.
When working through a Stock Valuation Checklist, examine questions such as:
- How much cash does the company hold?
- How much debt does it carry?
- How much debt matures relatively soon?
- Is interest expense increasing?
- Does operating cash flow comfortably support financial obligations?
- Could refinancing become more difficult under less favorable credit conditions?
Debt does not automatically make a stock unattractive.
Borrowing that funds productive investments can create value.
The problem arises when a low equity valuation hides financial obligations that absorb an increasing share of future cash flow or limit the company’s flexibility.
That is one reason enterprise-value-based valuation metrics can sometimes provide useful context alongside P/E.
Check Whether Shareholders Are Being Diluted
Company growth and shareholder growth are not always the same thing. A complete Stock Valuation Checklist should therefore examine not only total profit growth but also what happens on a per-share basis.
Suppose a company earns $100 million.
With 10 million shares:
Simplified EPS = $100 million ÷ 10 million = $10
Now assume the relevant share count increases to 12.5 million while total profit remains unchanged.
Simplified EPS = $100 million ÷ 12.5 million = $8
The business still earns $100 million, but the economic claim represented by each share has become smaller.
Real reported EPS calculations use the applicable weighted-average share count and accounting rules, so this example is intentionally simplified.
Dilution can arise from stock-based compensation, employee options, acquisitions financed with stock, convertible securities, or new equity issuance.
Not all dilution destroys shareholder value.
A company may issue stock and use the proceeds or acquired assets productively. What matters is whether the transaction improves long-term economics per share.
For that reason, compare the trend in diluted shares with metrics such as revenue per share, EPS, and free cash flow per share.
A company reporting 15% net-income growth while its diluted share count rises 10% is delivering a different shareholder outcome from a company generating the same profit growth with little or no dilution.
Headline corporate growth does not always equal shareholder growth.
Normalize Cyclical Earnings
Cyclicality is one of the easiest ways to mistake a cheap stock for a bargain.
Consider a hypothetical commodity producer:
| Period | EPS | Stock Price | P/E |
|---|---|---|---|
| Normal conditions | $4 | $60 | 15 |
| Industry boom | $10 | $80 | 8 |
During the boom, the share price rises from $60 to $80.
Yet the P/E falls from 15 to 8 because earnings increased much faster than the stock price.
On the surface, the stock looks cheaper.
Now assume unusually favorable industry conditions are responsible for the $10 EPS. If EPS later returns to $4 while the stock remains at $80:
Normalized P/E = $80 ÷ $4 = 20
The stock appeared cheapest precisely when earnings were strongest.
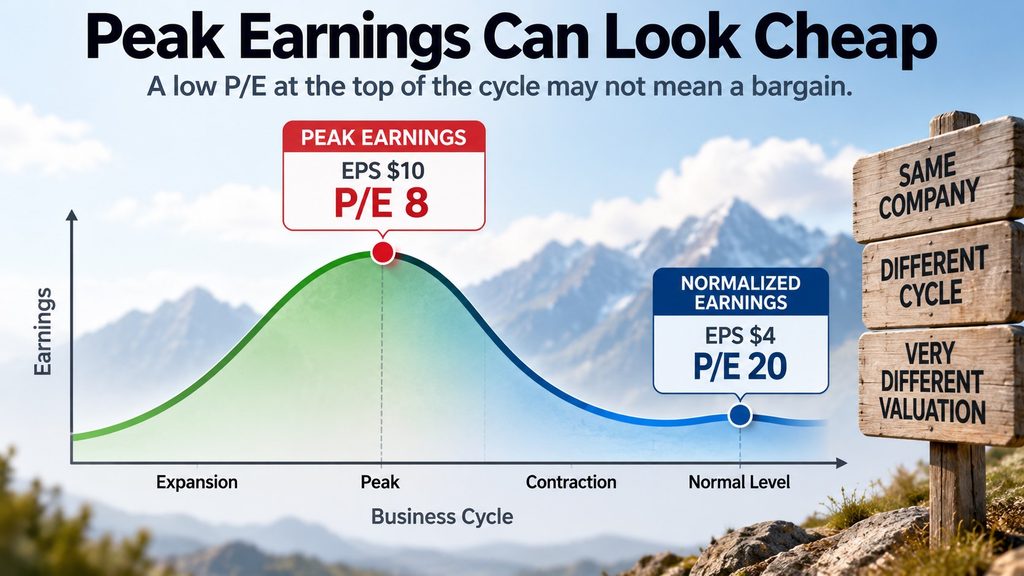
This is where a Stock Valuation Checklist needs more than today’s reported multiple.
A similar problem can affect commodity producers, semiconductor companies, banks, industrial businesses, homebuilders, retailers, and other cyclical industries, although the economic drivers differ.
Compare current results with a wider range of conditions:
- current margins versus historical margins;
- earnings across more than one stage of the business cycle;
- industry supply and demand;
- unusually favorable or unfavorable pricing;
- management’s discussion of current business conditions.
The central question is whether you are applying a low multiple to sustainable earnings or to temporary peak earnings.
The reverse can also happen.
A cyclical company near a trough may report a very high P/E—or no meaningful P/E at all—even though normalized earnings could eventually be higher.
Valuation without normalization can therefore mislead in both directions.
Judge the Quality of Growth
A low valuation may be justified when the business is shrinking.
A higher valuation can sometimes be understandable when a company is growing faster and producing better economics.
Consider two hypothetical businesses:
| Metric | Company A | Company B |
|---|---|---|
| P/E | 12 | 22 |
| EPS growth | -10% | +15% |
| Operating margins | Declining | Stable or improving |
Company A is mathematically cheaper based on current earnings.
That does not automatically make it the better value.
Investors may assign different multiples to businesses because their growth prospects, margins, competitive positions, financial risks, or returns on capital differ.
Revenue growth also needs interpretation. In a Stock Valuation Checklist, growth matters most when it eventually improves earnings, cash flow, or other measures of per-share economic value.
A company can increase sales rapidly while weakening its economics. If revenue rises 20% but expenses rise faster, margins shrink, and cash generation remains poor, headline sales growth may exaggerate the improvement in the underlying business.
A healthier pattern is:
Revenue growth → operating profit growth → EPS growth → free cash flow growth
Those figures will rarely move together perfectly.
The purpose is to determine whether additional revenue is eventually creating more profit and cash for shareholders.
A low-growth company’s low valuation may be a bargain.
It may also simply reflect weaker future economics.
Compare Valuation Only After the Fundamentals
After examining earnings, cash flow, debt, dilution, cyclicality, and growth quality, valuation metrics become much more informative.
The Stock Valuation Checklist therefore places valuation at the end rather than the beginning.
No single multiple works for every company.
| Metric | Basic Calculation | Often Useful For | Important Red Flag |
|---|---|---|---|
| P/E | Price ÷ EPS | Profitable companies with reasonably stable earnings | Peak-cycle or rapidly falling earnings |
| P/FCF | Market capitalization ÷ Free cash flow | Comparing price with cash generation | Temporary working-capital benefits or unusually low capital spending |
| P/S | Market capitalization ÷ Revenue | Businesses with limited or volatile current profits | Sales growth that fails to produce attractive margins |
| EV/EBITDA | Enterprise value ÷ EBITDA | Comparing operating businesses with different capital structures | EBITDA can look strong despite heavy capital spending or working-capital needs |
| P/B | Price ÷ Book value per share | Businesses where accounting book value is economically meaningful | Often less informative for businesses whose value depends heavily on intangible assets |
The SEC notes that desirable financial ratios vary by industry, another reason a single P/E cutoff cannot establish whether a stock is cheap.
A P/E of 10 can be expensive if earnings are about to collapse.
A P/E of 25 can potentially be reasonable if durable growth and cash generation support that valuation.
Useful comparisons include the company’s historical valuation, relevant competitors, expected growth, financial risk, normalized earnings, and cash generation.
Historical averages need context as well.
A company trading below its five-year average multiple does not automatically offer a bargain. The business may deserve a lower valuation because its growth, margins, financial strength, or competitive position has deteriorated.
Do not stop at “Is the multiple lower?”
Ask “Why is the multiple lower?”

Put the Stock Valuation Checklist Into Practice
When a stock looks cheap, do not begin by trying to prove that it is undervalued.
Try to disprove the idea.
Ask whether earnings are sustainable, whether cash generation supports those earnings, whether the balance sheet is healthy, whether dilution is controlled, whether current profits are normalized, and whether growth is economically productive.
Only then compare valuation.
That changes the question from:
“Why is this stock a bargain?”
to:
“What would have to be true for this low valuation to be justified?”
The goal is not to eliminate uncertainty. No checklist can do that.
The goal is to make the assumptions behind the valuation visible.
A Hypothetical Value-Trap Example
A hypothetical example shows why the Stock Valuation Checklist works better than relying on a low multiple alone.
Imagine a company trading at $50 with EPS of $5.
Its P/E is:
$50 ÷ $5 = 10
A 10 P/E initially appears inexpensive.
Now apply the Stock Valuation Checklist:
- revenue declined 5%;
- EPS fell from $6 to $5;
- free cash flow declined much faster than net income;
- total debt increased;
- interest expense rose;
- diluted shares increased 4%;
- current profit margins remain above their long-term norm.
The P/E is still 10.
But the interpretation has changed.
The market may not simply be overlooking a bargain. The discount may reflect expectations for weaker earnings, poorer cash conversion, greater financial risk, shareholder dilution, or lower normalized margins.
That does not prove the stock is overvalued.
It means the original claim—“the stock is cheap because its P/E is 10”—has not survived a deeper review.
That is exactly what a useful valuation process should reveal.
Where to Find the Numbers
A Stock Valuation Checklist is only as reliable as the financial information behind it. For U.S. public companies, the annual Form 10-K and quarterly Form 10-Q are key primary sources.
The SEC’s guide to reading a 10-K explains that the annual filing provides information about a company’s business, risks, and operating and financial results.
The financial statements allow investors to connect the income statement, balance sheet, cash flow statement, and shareholders’ equity rather than evaluating one ratio in isolation. The accompanying notes can provide important details about debt, accounting policies, stock compensation, acquisitions, taxes, and other items.
Management’s Discussion and Analysis, or MD&A, can add another layer of context.
SEC guidance describes MD&A as a narrative explanation intended to help readers understand a company’s financial condition and operating results, including the quality and potential variability of earnings and cash flow.
SEC Financial Reporting Manual: MD&A
For a cheap-looking stock, pay particular attention to explanations involving declining margins, changing demand, unusual pricing conditions, restructuring, debt and liquidity, capital expenditures, stock compensation, or other developments that could change sustainable earnings.
The numbers tell you what happened.
The filing can help explain why.
Final Takeaway: Cheap Is a Conclusion, Not a Starting Point
The central lesson from this Stock Valuation Checklist is that a falling stock price or a low valuation multiple is not the same thing as genuine undervaluation.
A stock can fall and become more attractive.
It can also fall because the company’s earnings power deteriorated faster than its share price.
A low P/E may reflect excessive pessimism—or it may correctly reflect weak growth, high debt, poor cash conversion, shareholder dilution, or cyclical earnings that are unlikely to last.
That is why valuation works better at the end of the process.
Start with earnings. Trace those earnings into cash. Check the balance sheet and share count. Normalize the business cycle. Judge whether growth is economically productive.
Then ask what those fundamentals are worth.
Cheap should be the conclusion of the analysis, not the assumption that begins it.
FAQ
Q1. Is a low P/E ratio enough to prove that a stock is cheap?
No. A low P/E can reflect genuine undervaluation, but it can also reflect falling earnings, cyclical peak profits, financial risk, or weak growth expectations. The important question is not simply whether the multiple is low, but why it is low.
Q2. Should I use P/E or free cash flow to value a stock?
Neither metric works universally. P/E focuses on accounting earnings, while free-cash-flow-based valuation focuses more directly on cash generation.
Comparing both can be especially useful when reported earnings look strong but cash generation remains weak.
Q3. Can a stock become more expensive after its share price falls?
Yes. If earnings fall faster than the share price, the P/E ratio can increase even while the stock price declines.
A falling share price therefore does not necessarily mean the stock has become cheaper relative to its fundamentals.
Q4. How can I tell if a stock is undervalued?
A practical valuation process starts by asking whether current earnings and cash flow are sustainable before comparing valuation multiples.
Then examine financial risk, dilution, cyclicality, and growth quality. Finally, compare the valuation with relevant peers, the company’s own history, and normalized fundamentals.
Q5. How do I avoid a value trap?
A valuation checklist can help identify warning signs such as deteriorating earnings, weak cash conversion, excessive debt, shareholder dilution, peak-cycle profits, and low-quality growth.
It cannot eliminate investment risk, but it can help investors test whether a seemingly cheap valuation is supported by sustainable fundamentals.
📚 Related Articles
Is a Low P/E Ratio Always Better? 5 Costly Mistakes to Avoid
Free Cash Flow Explained: Why Profitable Companies Can Still Run Into Trouble
Stock Valuation for Beginners: An Essential Guide to Spot Expensive Stocks

RSI Divergence vs MACD Crossover: Which Is More Reliable for Trading?
RSI divergence can warn that price momentum is weakening before a reversal becomes obvious. A…

Before You Buy the Dip: 5 Critical Balance Sheet Checks Every Investor Should Make
A stock that falls 20%, 30%, or even 50% can suddenly look cheap. But a…
Inverted Yield Curve: A Critical Guide to Avoid Costly Recession Mistakes
You see a headline saying the Treasury yield curve has inverted. Recession warnings suddenly appear…
Disclaimer: This article is for educational and informational purposes only and is not personalized financial or investment advice. Investment decisions should be based on your own circumstances, research, risk tolerance, and, when appropriate, professional guidance.