
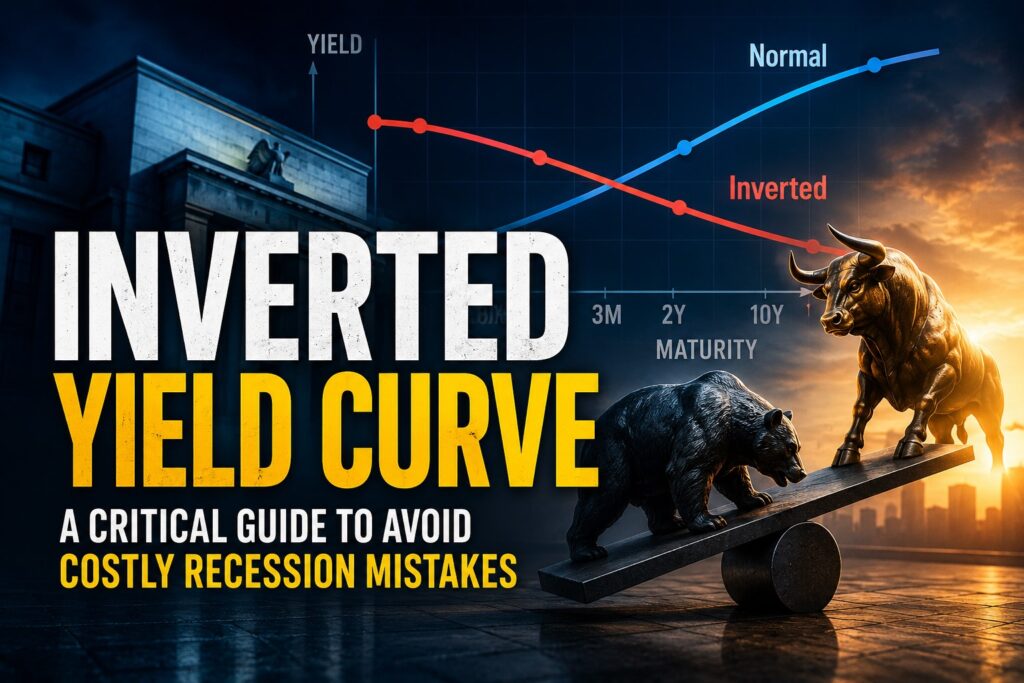
You see a headline saying the Treasury yield curve has inverted. Recession warnings suddenly appear everywhere.
The natural question is: Should I sell my stocks before the recession arrives?
That is exactly where many investors misuse the Inverted Yield Curve.
An inversion has historically provided useful information about future U.S. economic weakness, but it is not a countdown to a recession or a signal that stocks must immediately fall.
A better way to think about it is as an economic warning light. The important questions are why the curve inverted, whether other parts of the economy confirm the warning, and what happens when the curve eventually returns to normal.
What Is an Inverted Yield Curve?
A yield curve compares interest rates on bonds with different maturities.
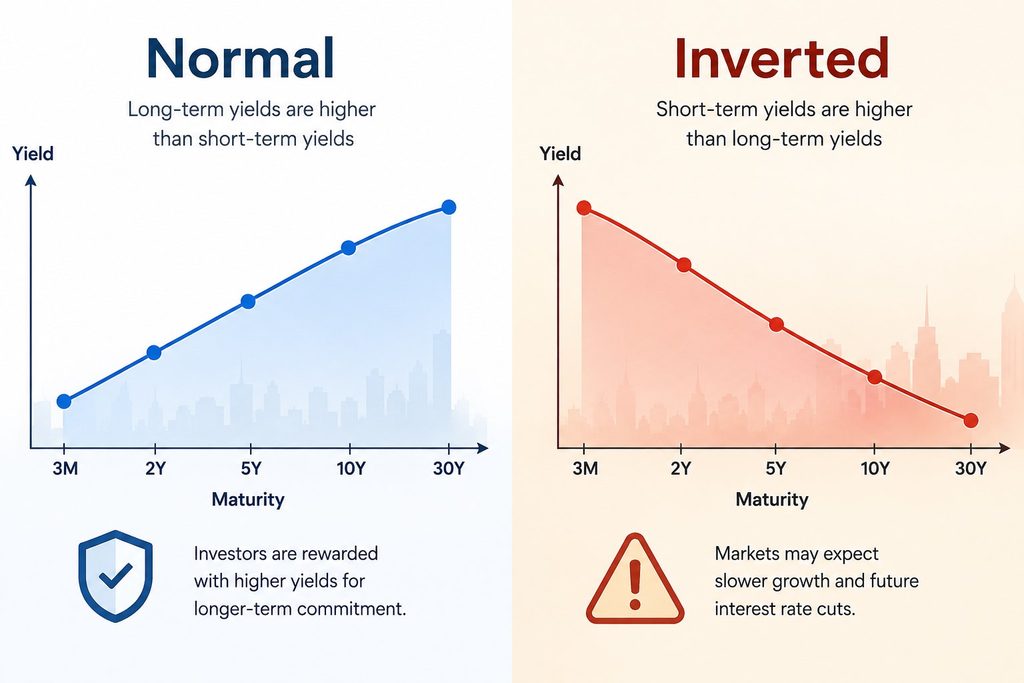
Under normal conditions, longer-term Treasury securities generally offer higher yields than shorter-term securities. Investors committing money for longer periods face greater uncertainty about future inflation, interest rates, and economic conditions.
A simplified normal yield curve might look like this:
| Treasury maturity | Hypothetical yield |
|---|---|
| 3-month | 3.5% |
| 2-year | 3.8% |
| 10-year | 4.3% |
The curve slopes upward.
An Inverted Yield Curve occurs when shorter-term Treasury yields rise above longer-term yields.
For example:
| Treasury maturity | Hypothetical yield |
|---|---|
| 3-month | 5.0% |
| 2-year | 4.8% |
| 10-year | 4.1% |
In this example, investors receive a higher yield for holding a short-term Treasury than a 10-year Treasury.
Two spreads are especially useful to watch:
- 10-year Treasury yield minus 2-year Treasury yield (10Y–2Y)
- 10-year Treasury yield minus 3-month Treasury yield (10Y–3M)
If the result is negative, that portion of the yield curve is inverted.
The Federal Reserve Bank of St. Louis publishes both the 10-year minus 2-year Treasury spread and 10-year minus 3-month Treasury spread through FRED.
Why Does the Yield Curve Invert?
The easiest way to understand an inversion is to separate what is happening at the short end of the curve from what investors expect further into the future.
Short-Term Yields Rise as the Fed Tightens
The Federal Reserve has much more direct influence over short-term interest rates than long-term Treasury yields.
When inflation is too high, the Fed may raise its policy rate. Short-term Treasury yields can rise as investors expect monetary policy to remain restrictive.
Suppose the 2-year Treasury yield rises to 5%.
That tells us the market expects relatively high short-term rates.
But what if the 10-year Treasury yield is only 4.2%?
The spread becomes:
4.2% − 5.0% = −0.8 percentage point
The 10Y–2Y curve is now inverted.
Long-Term Yields Reflect What Investors Expect Next
Why would investors accept 4.2% for ten years when a 2-year Treasury offers 5%?
One possible explanation is that markets do not expect today’s high short-term rates to last.
If restrictive monetary policy slows economic growth and inflation, investors may expect the Fed to lower rates later. Those expectations can help keep longer-term yields below current short-term yields.
Long-term yields also reflect inflation expectations, economic growth, Treasury supply, safe-haven demand, and the term premium, so no single factor explains every inversion.
Still, the basic message is useful:
Today’s monetary policy may be tighter than markets expect the economy to tolerate indefinitely.
That is why an Inverted Yield Curve attracts so much attention.
Why Is an Inverted Yield Curve a Recession Signal?
The relationship between the yield curve and U.S. recessions has been studied for decades.
Research from the Federal Reserve Bank of New York uses the spread between the 10-year Treasury yield and the 3-month rate to estimate recession probabilities twelve months ahead.
The economic logic matters as much as the historical correlation.
A tightening cycle can develop roughly like this:
High inflation → Fed tightening → expensive credit → weaker borrowing and investment → slower economic activity → expectations of future rate cuts
Higher borrowing costs can discourage companies from expanding. Mortgage and consumer-credit costs can weaken household demand. Tighter financial conditions can eventually pressure corporate profits and employment.
The yield curve may therefore be reflecting the market’s expectations about the delayed effects of restrictive monetary policy.
But there is an important distinction:
An Inverted Yield Curve is a leading indicator, not a countdown clock.
A recession does not have to begin immediately after inversion.
10Y–2Y vs. 10Y–3M: Which One Should Investors Watch?
Financial headlines often emphasize the 10Y–2Y spread.
It is widely followed and provides an intuitive picture of how medium-term monetary-policy expectations compare with long-term rates.
The 10Y–3M spread also deserves attention.
The New York Fed’s recession-probability model uses the 10-year and 3-month rates, and Federal Reserve research has frequently examined the 10Y–3M term spread as a recession indicator.
This does not mean one spread is a magical predictor and the other should be ignored.
A more useful approach is to ask whether different parts of the Treasury curve are telling a similar story.
A brief inversion in one spread is less informative than a broader signal accompanied by tightening credit, deteriorating labor conditions, and weaker earnings expectations.
What Does the Yield Curve Look Like Now?
An especially important part of reading the yield curve is understanding what happens after an inversion.
Using the latest FRED observations available when this article was prepared:
| Treasury spread | Latest observation used | Curve status |
|---|---|---|
| 10Y–2Y | +0.41 percentage point | Positive |
| 10Y–3M | +0.83 percentage point | Positive |
The 10Y–2Y reading is from August 31, 2026, while the 10Y–3M reading is from August 28, 2026.
In other words, these portions of the Treasury curve were no longer inverted on those dates. But an Inverted Yield Curve returning to positive territory does not automatically mean the economic warning has disappeared.
The reason the curve returned to positive territory matters more than the zero line itself.
Why Un-Inversion Can Matter as Much as Inversion
Suppose the yield curve moves from negative back to positive.
At first glance, that sounds reassuring. The curve is “normal” again.
But there are at least two very different ways this can happen.
Scenario 1: Long-Term Yields Rise
Long-term yields might increase because markets expect stronger growth, persistent inflation, or a higher term premium.
The curve can steepen even if short-term yields remain relatively high.
Scenario 2: Short-Term Yields Fall
The curve can also steepen because short-term yields fall rapidly.
Why would that happen?
Markets might be pricing future Fed rate cuts because inflation is cooling. But they could also be anticipating rate cuts because economic conditions are deteriorating.
The same positive yield spread can therefore emerge from very different economic stories.
This is one of the most useful lessons in reading the Inverted Yield Curve:
Do not stop at “inverted” or “not inverted.” Ask which yield moved and why.
The Curve → Credit → Labor → Earnings Framework

Rather than reacting to an Inverted Yield Curve in isolation, this article uses a simple analytical structure:
Curve → Credit → Labor → Earnings
It turns a recession headline into four questions that investors can actually investigate.
1. Curve: What Is Moving?
Start with the Treasury curve itself.
Are short-term yields rising because markets expect tighter Fed policy?
Are short-term yields falling because rate cuts are being priced in?
Are long-term yields moving because growth or inflation expectations changed?
The shape matters, but the movement underneath the shape tells you more.
2. Credit: Is Financial Stress Spreading?
Next, check whether restrictive rates are affecting access to credit.
Corporate bond spreads, bank lending standards, and financing conditions can help answer this question.
If the yield curve is sending a warning while credit remains readily available, the economic message may be different from a situation in which lenders are becoming much more cautious.
3. Labor: Is Weakness Reaching Employment?
The labor market is the next confirmation point.
Useful indicators include initial jobless claims, payroll growth, unemployment, and hiring trends.
A bond-market warning becomes more significant when labor demand is weakening at the same time.
4. Earnings: Are Companies Feeling It?
Finally, move from macroeconomic data to the stock market.
Are earnings estimates still rising, or are analysts cutting forecasts?
Are companies maintaining margins?
Is weaker demand beginning to appear in guidance?
For equity investors, this final step is critical because stocks ultimately respond to expectations for future cash flows and profits—not to the word “recession” by itself.
The purpose of Curve → Credit → Labor → Earnings is not to predict the exact month a recession will start.
It is to ask whether the yield curve’s warning is being confirmed as it moves from financial markets into the real economy and eventually into corporate fundamentals.
Why Investors Should Not Use the Yield Curve as a Sell Signal
Imagine that the yield curve inverts while unemployment remains low, credit conditions remain stable, and corporate earnings continue growing.
Selling an entire stock portfolio based on the inversion requires several additional predictions to be correct.
You would need to anticipate when the economy slows, when earnings decline, when the stock market reacts, how much risk has already been priced in, and when conditions eventually improve.
Being right that “recession risk is rising” is not the same as knowing when to exit and re-enter the market.
That is the investor dilemma that recession headlines often hide.
The Inverted Yield Curve is more useful for improving risk awareness than for pinpointing a market top.
How Investors Can Respond Without Trying to Predict the Market
An Inverted Yield Curve can be a useful reason to review portfolio risk, but it is not a reason to automatically abandon the market.
Start with concentration. If too much of the portfolio depends on one company, industry, or speculative theme, an economic slowdown can expose that risk quickly.
Then examine balance-sheet strength and valuation. Companies carrying substantial debt or requiring frequent refinancing may be more sensitive to restrictive credit conditions. Highly valued stocks can also become vulnerable when earnings expectations weaken.
Liquidity deserves attention as well. Appropriate cash reserves can provide flexibility during periods of market volatility, although the right allocation depends on an investor’s financial situation, time horizon, and risk tolerance.
For individual stocks, falling prices alone do not create an opportunity. A more useful question is whether the price fell because investors became temporarily more risk-averse or because expected earnings and business fundamentals deteriorated.
That distinction matters far more than the recession label.
The Biggest Mistake Is Treating One Indicator as a Forecast
The yield curve has an impressive historical reputation, but it is not infallible.
Long-term Treasury yields reflect more than recession expectations. Inflation expectations, global demand for safe assets, Treasury supply, central-bank policies, and term premiums can all affect the curve.
Federal Reserve researchers have also cautioned that there is no single best recession predictor for every forecasting horizon and economic environment.
This is why the Curve → Credit → Labor → Earnings framework matters.
If only the curve is flashing a warning, uncertainty remains high.
If credit conditions deteriorate, labor-market weakness spreads, and earnings expectations fall as well, the economic evidence becomes much harder to dismiss.
That is a more useful distinction than simply asking whether the spread is above or below zero.
Final Takeaway
The Inverted Yield Curve deserves attention because Treasury term spreads have historically contained useful information about future U.S. economic weakness.
But the curve cannot tell investors the exact date of the next recession or stock-market peak.
Start with the curve. Then check credit. Watch the labor market. Finally, determine whether economic weakness is reaching corporate earnings.
And when an inverted curve returns to positive territory, do not automatically assume the warning is over. Find out why it steepened.
That is the difference between using the yield curve as an analytical tool and treating it as a trading signal.
Treat it as an economic warning light—not as an automatic sell button.
FAQ
Q1. What does an inverted yield curve mean?
An inverted yield curve means short-term Treasury yields are higher than long-term yields. It often reflects tight monetary policy and expectations that growth or interest rates may weaken later.
Q2. Does an inverted yield curve always cause a recession?
No. It is a warning signal, not a guarantee. Its significance increases when labor, credit, and earnings data are also weakening.
Q3. Which matters more: the 10Y–2Y or 10Y–3M spread?
Both are useful. The 10Y–2Y spread is widely followed by markets, while the 10Y–3M spread has played an important role in Federal Reserve recession research.
Q4. Is yield curve un-inversion good for stocks?
Not automatically. The curve can normalize because long-term yields rise or because short-term yields fall. The reason behind the change matters more than simply returning above zero.
Q5. Should I sell stocks when the yield curve inverts?
Not based on the yield curve alone. Investors should also consider credit conditions, labor data, earnings trends, valuation, diversification, and their own investment horizon.
📚 Related Articles
Interest Rates and the Stock Market: A Beginner’s Practical Guide
Recession Signals: An Essential Beginner’s Guide to Reading the Economy and Stock Market
How to Read US CPI Data: What Every Investor Should Know
Inflation and Stock Investing: A Smart and Essential Beginner’s Guide

Stock Valuation Checklist: 7 Critical Checks Before Calling a Stock Cheap
A stock can look cheap because its price has fallen 40%, its P/E ratio is…
RSI Divergence vs MACD Crossover: Which Is More Reliable for Trading?
RSI divergence can warn that price momentum is weakening before a reversal becomes obvious. A…

Before You Buy the Dip: 5 Critical Balance Sheet Checks Every Investor Should Make
A stock that falls 20%, 30%, or even 50% can suddenly look cheap. But a…
Disclaimer: This article is for educational and informational purposes only and is not personalized financial or investment advice. Investment decisions should be based on your own circumstances, research, risk tolerance, and, when appropriate, professional guidance.