
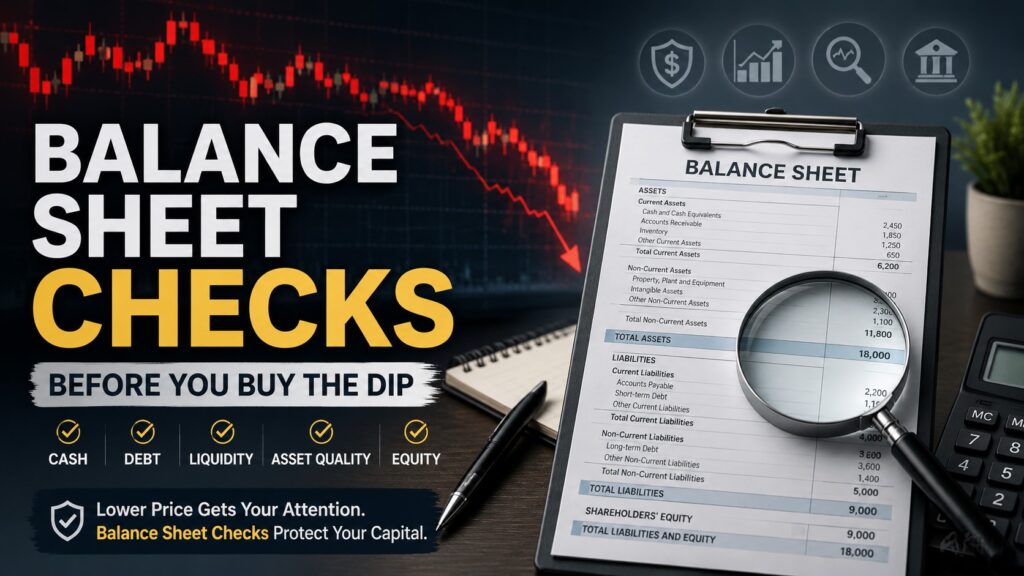
A stock that falls 20%, 30%, or even 50% can suddenly look cheap.
But a lower share price does not automatically mean a better investment.
Before buying the dip, investors should ask a more important question:
Has the company’s financial position remained strong, or has the business itself become more fragile?
These five Balance Sheet Checks can help answer that question.
A balance sheet shows what a company owns, what it owes, and the residual value attributable to shareholders at a specific point in time. The basic accounting equation is:
Assets = Liabilities + Shareholders’ Equity
When a stock falls sharply, the goal is not to find one perfect ratio. It is to determine whether the company still has enough financial flexibility to handle weaker conditions.
Why Balance Sheet Checks Matter After a Stock Falls
Suppose a stock falls from $100 to $60 while its last reported earnings remain unchanged.
Its price-to-earnings ratio falls too, so the stock appears cheaper.
But the market may already be anticipating something historical earnings have not fully captured.
Demand could be slowing. The company may need to refinance debt at higher rates. Cash could be declining while inventory builds. An expensive acquisition may have left the business carrying more debt or goodwill than investors previously worried about.
This is what makes buying the dip difficult:
The stock price can change before the financial statements fully reveal what has changed in the business.
A lower valuation is therefore a reason to investigate, not proof that a stock is undervalued.
Check #1: Cash and Cash Equivalents
The first of these Balance Sheet Checks is the company’s cash position.
Cash gives management flexibility. It can help fund operations, repay debt, continue investing during a downturn, or simply give the business more time to adjust when conditions deteriorate.
But cash should not be viewed in isolation.
Consider two hypothetical companies:
| Metric | Company A | Company B |
|---|---|---|
| Cash | $2.0B | $2.0B |
| Total Debt | $0.5B | $5.0B |
| Cash Minus Debt | $1.5B | -$3.0B |
Both companies have $2 billion in cash.
Their financial flexibility is very different.
Company A has more cash than debt. Company B has substantially more debt than cash.
Instead of asking only:
“How much cash does the company have?”
Ask:
“How much cash does it have relative to its obligations?”
The trend matters too.
A $3 billion cash balance may look reassuring until you discover that the company had $6 billion two years ago and has been consuming cash every quarter.
What to look for: stable cash, manageable obligations, and no persistent cash drain that could eventually force the company to raise capital.
Check #2: Debt and Refinancing Risk
Debt is not automatically a warning sign.
Companies borrow to finance acquisitions, factories, equipment, expansion, and other investments. Some stable businesses can support significant debt without financial distress.
The more useful question is whether the company can comfortably support its obligations.
Suppose a hypothetical company reports:
- $1 billion in cash
- $4 billion in debt
- $1 billion in shareholders’ equity
Its simplified debt-to-equity ratio would be:
Debt-to-Equity = $4 billion ÷ $1 billion = 4.0
That ratio alone does not tell you whether the stock should be avoided.
Capital structures vary by industry. Book equity can also be influenced by accumulated profits or losses, share repurchases, acquisitions, and accounting decisions.
For practical Balance Sheet Checks, I would be more interested in what is happening around the debt:
- Is total debt increasing?
- Is cash declining at the same time?
- Does a large amount of debt mature soon?
- Can the business generate enough cash to pay interest?
- Would significant borrowing need to be refinanced at higher rates?
These questions become especially important when a stock is falling because business conditions are deteriorating.
A highly leveraged company has less room for error if revenue, margins, and cash flow weaken together.
What to look for: debt that remains manageable relative to cash generation, without obvious near-term refinancing pressure.

Check #3: Near-Term Liquidity
The next of the five Balance Sheet Checks is short-term liquidity.
Two simple calculations can help:
Working Capital = Current Assets − Current Liabilities
Current Ratio = Current Assets ÷ Current Liabilities
Consider a hypothetical company with:
- Current assets: $3.0 billion
- Current liabilities: $2.0 billion
Its working capital is:
$3.0 billion − $2.0 billion = $1.0 billion
Its current ratio is:
$3.0 billion ÷ $2.0 billion = 1.5
At first glance, that looks comfortable.
But not all current assets are equally liquid.
Current assets can include cash, short-term investments, accounts receivable, inventory, and other items. A company holding $1 billion of cash has a different liquidity profile from one whose current assets consist largely of inventory that may take months to sell.
This creates an important investor dilemma.
A current ratio can remain healthy even while the composition underneath it becomes weaker.
If cash is declining while inventory and receivables are rising, I would want to understand why before concluding that liquidity is improving.
What to look for: enough genuinely liquid assets to meet near-term obligations without relying heavily on inventory sales or additional borrowing.
Check #4: Asset Quality
One of the most overlooked Balance Sheet Checks is asset quality, because total assets can increase even while the quality of those assets deteriorates.
Three categories deserve particular attention.
Inventory
Rising inventory is not necessarily bad.
A company might be preparing for stronger demand, launching new products, entering new markets, or building stock ahead of a seasonal sales period.
The question is whether inventory growth makes sense relative to the business.
Imagine revenue rises 5% while inventory rises 40%.
That does not prove there is a problem, but it gives investors something specific to investigate.
Ask:
- Is demand slowing?
- Is management intentionally building inventory?
- Are older products becoming difficult to sell?
- Could future discounts or write-downs reduce margins?
The balance sheet provides the clue. The business explanation determines whether that clue matters.
Accounts Receivable
Accounts receivable represents money customers owe the company.
If receivables consistently grow much faster than sales, I would want to know why.
It may simply reflect normal payment timing or a change in customer mix.
But it could also mean customers are taking longer to pay.
For a company already facing weaker conditions, slower collections can reduce liquidity at exactly the wrong time.
Goodwill and Intangible Assets
Goodwill commonly appears after acquisitions when the purchase price exceeds the identifiable net assets acquired.
A large goodwill balance is not automatically a red flag.
However, if an acquisition performs much worse than expected, the company may eventually recognize an impairment.
Before buying a stock after a sharp decline, I would therefore want to understand what the asset base actually consists of.
How much comes from cash, receivables, inventory, property, and other productive assets?
How much depends on goodwill or intangible assets associated with previous acquisitions?
What to look for: assets that remain economically useful, collectible, or productive rather than simply an impressive total-assets number.
Check #5: Shareholders’ Equity
The final item in these Balance Sheet Checks is shareholders’ equity.
Shareholders’ equity represents the residual interest after liabilities are deducted from assets.
But positive equity does not automatically mean a company is financially strong, just as negative equity does not automatically mean it is close to bankruptcy.
Equity can change because of:
- profits or losses,
- share repurchases,
- dividends,
- acquisitions,
- accounting adjustments.
The cause matters more than the headline number.
If shareholders’ equity is shrinking because the company repeatedly loses money while debt continues to rise, that deserves attention.
If book equity declined mainly because a profitable company repurchased a large amount of its own shares, the interpretation may be very different.
So rather than asking:
“Is shareholders’ equity positive?”
Ask:
“Why is shareholders’ equity changing?”
This is another reason balance-sheet analysis works better when investors compare several reporting periods rather than relying on one snapshot.
What to look for: changes in equity that make sense when compared with profitability, debt, and the company’s capital-allocation decisions.
Put the Five Checks Together
The real value of these Balance Sheet Checks comes from using them together rather than relying on a single ratio.
Consider two hypothetical companies whose stocks have both fallen 35%.
| Balance Sheet Signal | Stronger Company | More Fragile Company |
|---|---|---|
| Cash | Stable | Falling quickly |
| Debt | Manageable | Rising |
| Near-Term Liquidity | Comfortable | Tight |
| Inventory / Receivables | Moving roughly with sales | Growing much faster than sales |
| Shareholders’ Equity | Relatively stable | Falling from repeated losses |
The stock-price decline is identical.
The financial situation is not.
The stronger company may have more time and flexibility to recover if business conditions improve. The more fragile company may eventually face refinancing, asset sales, spending cuts, or new share issuance if weakness continues.
That is the purpose of Balance Sheet Checks: not to predict next month’s stock price, but to judge how much financial stress the underlying business may be able to absorb.
A Strong Balance Sheet Does Not Mean a Stock Is Cheap
A company can have no debt, billions of dollars in cash, and excellent liquidity—and still be a poor investment at the wrong valuation.
Balance-sheet strength answers:
Can the company withstand financial stress?
Valuation asks:
What price am I paying for the business and its future earnings or cash flows?
Those are different questions.
That is why investors should read the balance sheet alongside the income statement and cash flow statement. The balance sheet provides a snapshot of financial position, while the other statements help explain profitability and cash generation over time.
Where to Find the Numbers
For U.S. public companies, investors can usually find these figures in annual Form 10-K filings and quarterly Form 10-Q filings.
The SEC provides free public access to company filings through its EDGAR system. SEC EDGAR Search Filings The SEC’s Investor.gov guide also explains that 10-K financial statements include balance sheets, income statements, cash-flow statements, and statements of stockholders’ equity. Investor.gov: How to Read a 10-K/10-Q
Do not examine only the latest quarter.
Compare several reporting periods and track major items such as:
- cash,
- total debt,
- current liabilities,
- inventory,
- accounts receivable,
- goodwill,
- shareholders’ equity.
One reporting period shows where the company stands.
Repeating the same Balance Sheet Checks across several reporting periods helps reveal whether the company’s financial condition is strengthening or deteriorating.
The Price → Survival → Value Framework

When a stock falls sharply, the full balance sheet can feel like too much information.
A simpler way to organize the analysis is to remember three questions.
Step 1 — Price: Why Did the Stock Fall?
First identify what changed.
Was the decline driven by the broader market, lower earnings expectations, slower growth, a company-specific problem, or simply a lower valuation multiple?
A 30% decline caused mainly by market-wide risk aversion is different from a 30% decline caused by severe deterioration in the underlying business.
Step 2 — Survival: Can the Business Handle Another Weak Year?
This is where the five Balance Sheet Checks become especially useful.
Imagine that conditions remain difficult longer than expected.
Does the company have enough cash? Can it meet near-term obligations? Is debt manageable? Are inventory and receivables under control?
Would the company still have financial flexibility if earnings or cash flow remained weak for another year?
This is a stress test, not a forecast. Its purpose is to identify vulnerabilities before assuming that a lower share price has created an opportunity.
Step 3 — Value: Is the New Price Actually Attractive?
Passing the survival test does not automatically make the stock a bargain.
The final question is whether the lower valuation adequately reflects the company’s risks, growth prospects, profitability, and future cash-generating potential.
That sequence prevents investors from starting with price alone.
Price tells you why the stock caught your attention.
Survival tells you whether the business can endure the problem.
Value tells you whether the new price compensates for the remaining risk.
Final Takeaway
Buying the dip can be tempting because the lower price is immediately visible.
The financial weakness behind that decline may be much harder to see.
Use Balance Sheet Checks to answer the survival question before focusing on valuation. Look for financial flexibility, manageable obligations, and asset quality rather than relying on one headline ratio.
Then return to price.
A resilient balance sheet can give a company time to recover, but it cannot make an expensive stock cheap or guarantee that a damaged business will improve.
Remember the sequence:
Price → Survival → Value
The lower price gets your attention.
The balance sheet helps you understand what you may actually be buying.
FAQ
Q1. Is a current ratio above 1 always a sign of strong liquidity?
No. It means current assets exceed current liabilities, but the composition of those assets matters. A company holding mostly cash has a different liquidity profile from one relying heavily on inventory or slow-paying receivables.
Q2. Can a company with negative shareholders’ equity still be financially healthy?
In some cases, yes. Negative equity can result from accumulated losses, large share repurchases, or other capital-allocation and accounting effects. Investors should identify the cause and evaluate it alongside debt, profitability, and cash flow.
Q3. How many years of balance sheets should investors compare?
There is no universal rule. Comparing multiple quarterly and annual reporting periods is generally more useful than reviewing a single snapshot because it helps reveal trends in cash, debt, liquidity, asset quality, and equity.
📚 Related Articles
How to Read Financial Statements: A Simple and Powerful Beginner’s Guide
Free Cash Flow Explained: Why Profitable Companies Can Still Run Into Trouble
How to Analyze a Stock Before Buying: A Practical 7-Step Checklist

Stock Valuation Checklist: 7 Critical Checks Before Calling a Stock Cheap
A stock can look cheap because its price has fallen 40%, its P/E ratio is…

RSI Divergence vs MACD Crossover: Which Is More Reliable for Trading?
RSI divergence can warn that price momentum is weakening before a reversal becomes obvious. A…

Inverted Yield Curve: A Critical Guide to Avoid Costly Recession Mistakes
You see a headline saying the Treasury yield curve has inverted. Recession warnings suddenly appear…
Disclaimer: This article is for educational and informational purposes only and is not personalized financial or investment advice. Investment decisions should be based on your own circumstances, research, risk tolerance, and, when appropriate, professional guidance.