
How to Read Financial Statements is one of the most valuable skills a beginner investor can learn.
Many people start investing by following stock prices, watching financial news, or reading social media discussions. Those sources can be useful, but they often focus on short-term market movements rather than the underlying business.
Financial statements are different. They help you understand what is actually happening inside a company.
At first, they can look intimidating. Annual reports often contain dozens of pages filled with tables, accounting terms, and financial jargon.
The good news is that you do not need an accounting degree to understand the basics. Most investors can build a strong foundation by learning three core reports:
- Income Statement
- Balance Sheet
- Cash Flow Statement
Once you understand these reports, you can evaluate businesses with more confidence and rely less on headlines or market opinions.
When I first started investing, I spent far more time watching stock prices than reading financial statements. Looking back, learning to review these reports gave me a much clearer understanding of what I was actually buying.
How to Read Financial Statements: Understanding the Three Core Reports
Financial statements are official reports that summarize a company’s financial performance and financial position. Public companies publish these reports regularly so investors can understand how the business is performing.
A simple way to think about them is:
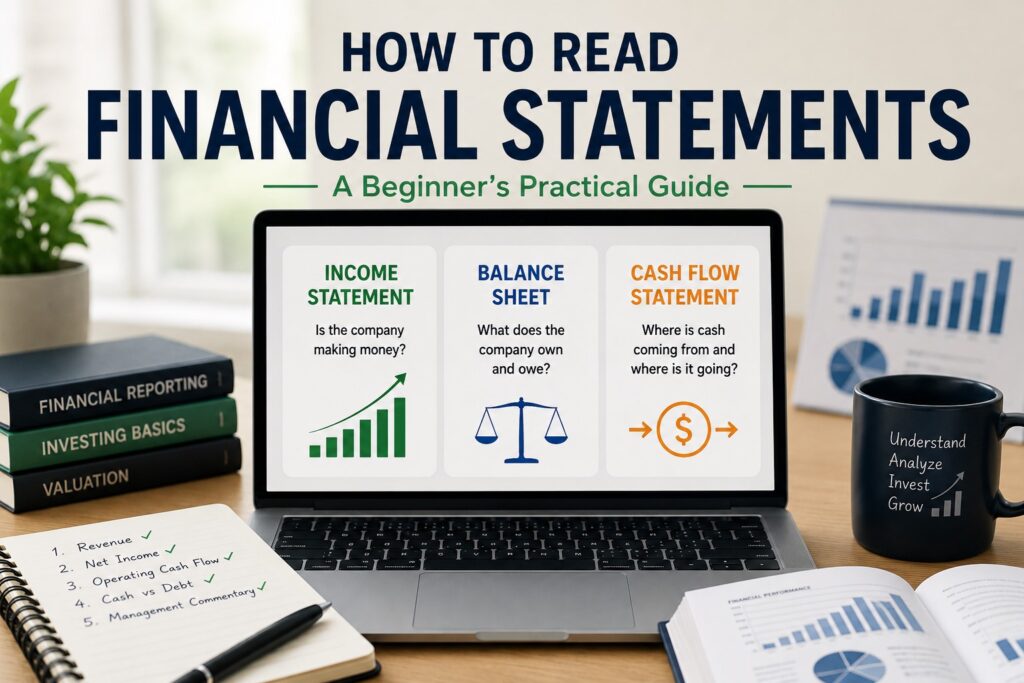
| Statement | Main Question |
|---|---|
| Income Statement | Is the company making money? |
| Balance Sheet | What does the company own and owe? |
| Cash Flow Statement | Where is cash coming from and where is it going? |
Each statement provides a different perspective.
The mistake beginners often make is looking at only one report. A company may report growing sales while struggling to generate cash. Another company may be profitable but carry significant debt.
This is why experienced investors usually review all three statements together rather than focusing on a single metric.
Income Statement
The income statement shows how much money a company earned and how much profit remained after expenses.
The three figures I usually pay attention to first are:
- Revenue
- Operating Income
- Net Income
Revenue represents money generated from selling products or services. Expenses represent the costs required to operate the business. Net income shows what remains after all expenses have been deducted.
When I first started researching stocks, I focused almost entirely on revenue growth. If a company was growing quickly, I assumed it must be performing well.
Over time, I realized that revenue alone does not tell the whole story.
A company can increase sales while profitability deteriorates. For example, many fast-growing technology companies experience periods where revenue grows rapidly while profitability remains under pressure because of heavy investment spending on hiring, marketing, product development, or infrastructure.
Looking at both revenue and net income together helps investors avoid focusing on growth alone.
Imagine two companies.
Company A grows revenue by 30%, but net income keeps falling because expenses continue rising.
Company B grows revenue by only 8%, but profits remain stable and operating cash flow continues improving.
In practice, I would usually spend more time studying Company B first. That does not mean Company B is automatically the better investment. It simply means the financial statements suggest a more stable business model that deserves closer attention.
The key question is not:
“Are sales increasing?”
It is:
“Are those sales becoming sustainable profits?”
Balance Sheet
The balance sheet provides a snapshot of a company’s financial position at a specific point in time.
It consists of three major components:
- Assets
- Liabilities
- Shareholders’ Equity
Assets are resources the company owns. Examples include cash, inventory, buildings, and equipment.
Liabilities are obligations the company owes. Examples include bank loans, bonds, and accounts payable.
Shareholders’ equity represents what remains after liabilities are subtracted from assets.
A simple rule I like is to look at cash and debt before diving into smaller details. When two companies generate similar profits, the company with stronger cash reserves and more manageable debt may have greater flexibility during difficult economic periods.
The balance sheet helps answer a practical question:
“If business conditions become challenging, how financially prepared is this company?”
Debt is not automatically bad. Many successful companies use debt productively. However, if debt keeps increasing while profits and cash flow remain weak, I treat that as a signal to investigate more carefully.
Cash Flow Statement
Many beginners spend very little time on the cash flow statement. Ironically, it may be the most useful report of the three.
The reason is simple. Profits can be influenced by accounting assumptions, but cash is harder to ignore.
The cash flow statement is generally divided into:
- Operating Cash Flow
- Investing Cash Flow
- Financing Cash Flow
Operating cash flow shows cash generated by the company’s core business. Investing cash flow reflects purchases of equipment, acquisitions, and investments. Financing cash flow includes debt issuance, debt repayment, dividends, and stock issuance.
One beginner misunderstanding is assuming that a profitable company automatically generates strong cash flow. That is not always true.
A company may report earnings while customers delay payments or inventory continues building up.
In my own investing routine, I pay close attention whenever operating cash flow consistently trails reported profits. It does not automatically mean something is wrong, but it tells me there may be a story worth investigating.
For beginners who want a deeper explanation of how the three statements work together, Investopedia has a useful financial statements guide.
A 10-Minute Financial Statement Review Routine
When I review a company for the first time, I try not to read every line of the annual report. Instead, I follow a simple process.
Step 1: Check Revenue
Look at revenue over the last three years.
One strong quarter can be exciting, but a multi-year trend is often more meaningful.
Step 2: Check Net Income
Compare profits over the same period.
Are earnings improving alongside revenue? Or are expenses growing faster than sales?
Step 3: Check Operating Cash Flow
This is often the number I examine most carefully.
If net income appears strong but operating cash flow remains weak, I want to understand why.
Step 4: Review Cash and Debt
Check how much cash the company holds and compare it with total debt.
Debt is not automatically bad. The question is whether the company appears capable of managing it comfortably.
Step 5: Read Management Commentary
Numbers tell part of the story. Management discussions often explain major changes, risks, and future priorities.
One practical change I made early in my investing journey was creating a simple note-taking routine.
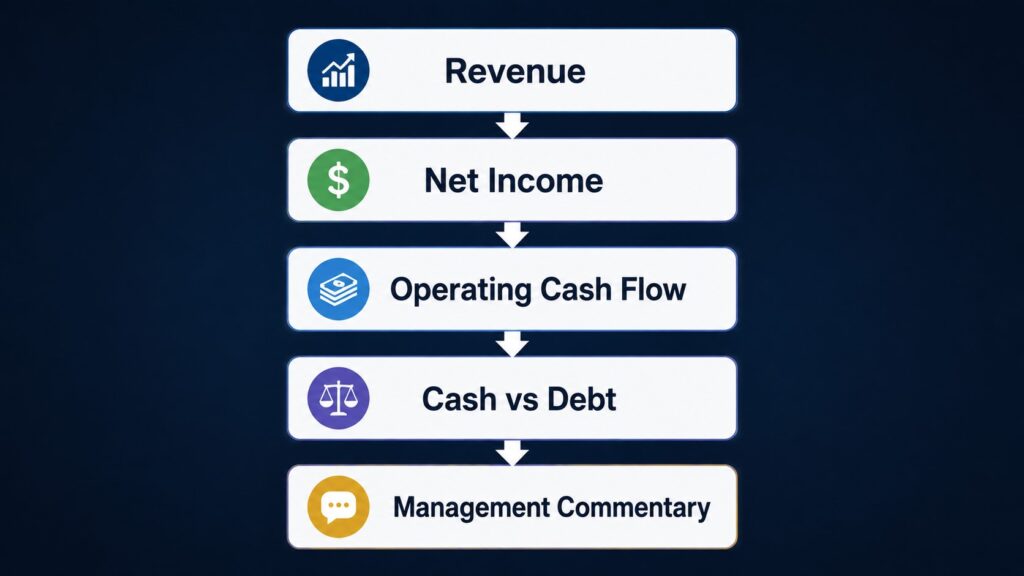
Before reading analyst opinions, stock price targets, or social media discussions, I write down five figures first:
- Revenue
- Net Income
- Operating Cash Flow
- Cash
- Debt
Before I adopted this routine, I often became interested in companies simply because their stock prices were rising quickly. More than once, I later discovered that strong revenue growth was being accompanied by weak cash flow or rising debt.
Writing down these five numbers first helped me slow down and evaluate businesses more objectively. It also helped me separate the company’s financial reality from the excitement surrounding the stock.
3 Numbers I Check First
When financial statements feel overwhelming, I simplify the process.
These are usually the first three numbers I review.
1. Revenue
I want to see whether revenue has generally moved higher over several years. Consistent growth often tells a more useful story than one strong quarter.
2. Net Income
Revenue growth matters, but I also want to know whether the company is becoming more profitable.
3. Operating Cash Flow
This is often my reality check.
If net income looks strong but operating cash flow remains weak, I slow down and investigate further.
The goal is not to find perfect numbers. The goal is to understand whether the business appears healthy and sustainable.
Common Beginner Mistakes
Looking at Only One Quarter
Business performance can fluctuate significantly from quarter to quarter. Longer-term trends often provide better context.
Focusing Only on Revenue
Revenue growth attracts attention, but profitability and cash generation provide additional context.
Ignoring Debt
Even profitable businesses can face challenges if debt becomes excessive.
Reading Numbers Without Context
Financial statements become more useful when compared across several years.
Searching for One Perfect Metric
There is no single number that explains everything. Strong analysis comes from combining multiple pieces of information.
Reading Opinions Before Reading Statements
This was one of my own mistakes.
I sometimes read market commentary first and then looked for numbers that supported the story. Today, I prefer reviewing the financial statements before reading outside opinions.
That small change makes the process feel more objective.
Simple Checklist
Before analyzing a stock, run through this checklist.
Financial Statement Checklist
✓ Review revenue trends over multiple years
✓ Check net income trends
✓ Examine operating cash flow
✓ Compare cash reserves and debt
✓ Review recent annual and quarterly reports
✓ Read management commentary
✓ Compare current results with previous years
✓ Avoid making decisions based on one metric alone
✓ Form a basic view before reading market opinions
Final Thoughts
If you are completely new to stock research, you may also find my guide on Fundamental Analysis for Beginner Investors helpful.
Financial statements become much easier to understand once you see how they fit into the broader process of evaluating a business.
Learning how to read financial statements is not about becoming an accountant. It is about understanding the financial story behind a business.
If you are completely new to financial reports, the SEC’s investor education resources provide a helpful introduction to annual reports and financial statements.
The income statement explains profitability. The balance sheet reveals financial strength. The cash flow statement shows how money actually moves through the company.
Together, these reports provide a clearer picture than headlines, stock price movements, or online opinions alone.
Looking back, learning how to read financial statements changed the way I approach investing. Instead of relying entirely on stock price movements or market opinions, I now spend a few minutes reviewing the underlying business first.
It does not guarantee successful investments, but it helps me make decisions based on evidence rather than excitement.
Practical Investor Takeaway
Try this simple exercise today.
Visit the SEC EDGAR database to search official company filings and review annual reports directly from public companies. Download its latest annual report and write down only three numbers:
- Revenue
- Net Income
- Operating Cash Flow
Then compare those figures with the previous two years.
This small exercise can teach you more about business fundamentals than hours of market commentary. The goal is not to predict the future.
The goal is to build a better framework for understanding companies.
❓ FAQ
Q1. Why are financial statements important for investors?
They help investors understand a company’s profitability, financial position, and cash generation.
Q2. Which financial statement should beginners read first?
Many beginners start with the income statement because it is generally the easiest to understand.
Q3. Can a company be profitable but have weak cash flow?
Yes. Accounting profits and cash generation are not always the same thing.
Q4. How often do public companies publish financial statements?
Most public companies publish quarterly and annual reports.
Q5. Do I need accounting expertise to read financial statements?
No. Understanding a few key concepts and metrics can provide valuable insights.
Q6. What is the most important financial statement?
There is no single best financial statement.
Many investors start with the income statement because it is easier to understand. However, reviewing the income statement, balance sheet, and cash flow statement together usually provides the clearest picture of a company’s financial health.
📚 Further Reading
[Trading Basics] Candlestick Charts for Beginners: Easy Guide to Reading Price Action
[Macro Analysis] Interest Rates and the Stock Market: A Beginner’s Practical Guide
[Macro Analysis] Inflation and Stock Investing: A Smart and Essential Beginner’s Guide

Fundamental Analysis for Beginner Investors: A Smart Guide to Better Stock Decisions
Fundamental Analysis for Beginner Investors is not about memorizing accounting terms. It is about learning…

How U.S. Treasury Yields Affect Tech Stocks: A Smart and Powerful Beginner’s Guide
How U.S. Treasury Yields Affect Tech Stocks is one of the most important macro relationships…

Moving Averages in Stocks: The Ultimate Guide to Clear Trend Reading
If you have ever opened a stock chart and noticed smooth lines moving across the…
Disclaimer: This article is for educational purposes only. It is not financial advice or a recommendation to buy or sell any specific stock, ETF, cryptocurrency, or other asset. All investment decisions are your own responsibility.