
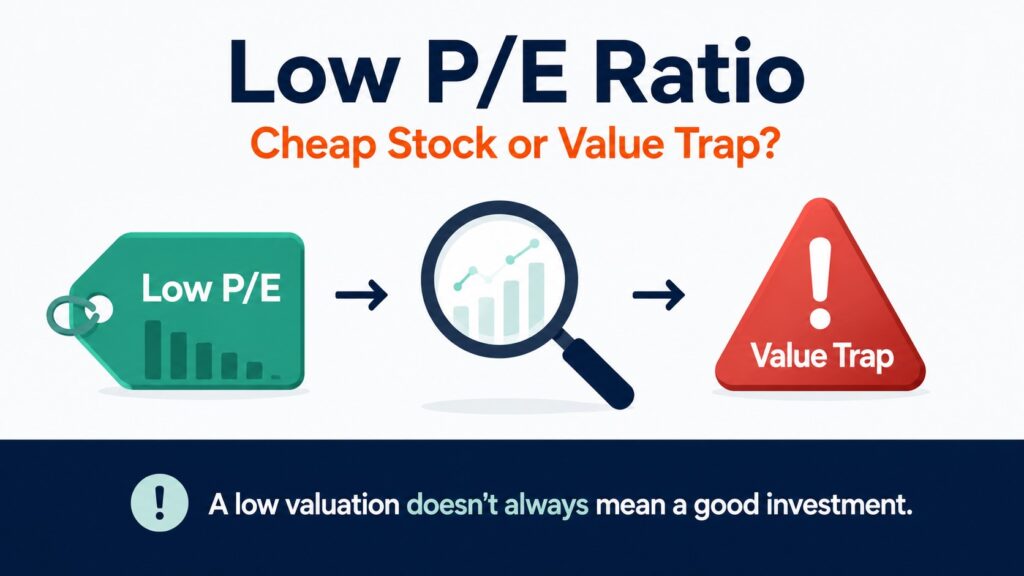
When I first began studying stock valuation, the P/E ratio seemed like the easiest number to trust.
A company trading at 8 or 10 times earnings looked like an obvious bargain—until I started comparing its earnings with revenue, cash flow, debt, and industry conditions. That was when I realized that a low P/E ratio can represent either a genuine opportunity or a value trap.
A low P/E ratio is still a useful starting point, but it should never be treated as the final answer. This guide explains five common mistakes beginner investors make and a practical process for evaluating low-P/E stocks more carefully.
What Does a Low P/E Ratio Actually Tell You?
According to Investor.gov’s explanation of the P/E ratio, the price-to-earnings ratio compares a company’s current share price with its earnings per share.
The basic formula is:
P/E Ratio = Share Price ÷ Earnings per Share
For example, a stock priced at $50 with annual earnings of $5 per share has a P/E ratio of 10.
At first glance, that may appear cheaper than a stock trading at 30 times earnings.
However, the calculation does not tell you whether those earnings are stable, growing, temporarily inflated, declining, supported by cash flow, or likely to continue.
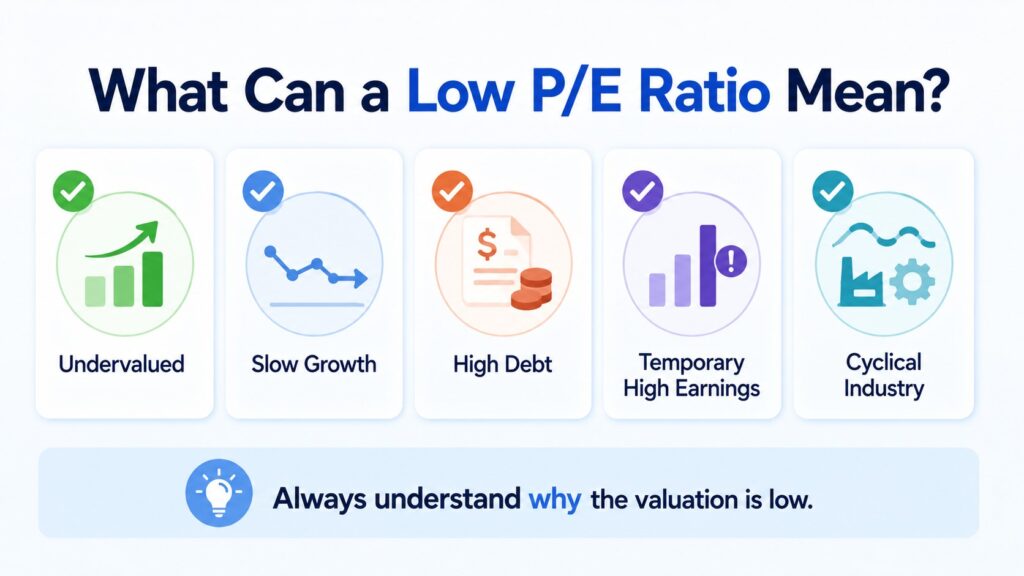
A low P/E ratio may indicate that:
- the stock is genuinely undervalued;
- investors expect slower future growth;
- the company faces financial or competitive risks;
- current earnings are temporarily high;
- the industry is near the top of a business cycle.
This is why low P/E and undervalued are not interchangeable terms.
Mistake #1: Treating Every Low P/E Ratio as a Bargain
The first mistake is assuming that the market has simply overlooked the company.
Consider two companies trading at similar P/E ratios.
The first company has:
- stable revenue;
- consistent operating cash flow;
- manageable debt;
- a temporary problem that may be resolved.
The second company has:
- declining sales;
- shrinking profit margins;
- rising debt;
- competitors taking market share.
Their P/E ratios may look similar, but the underlying businesses are very different.
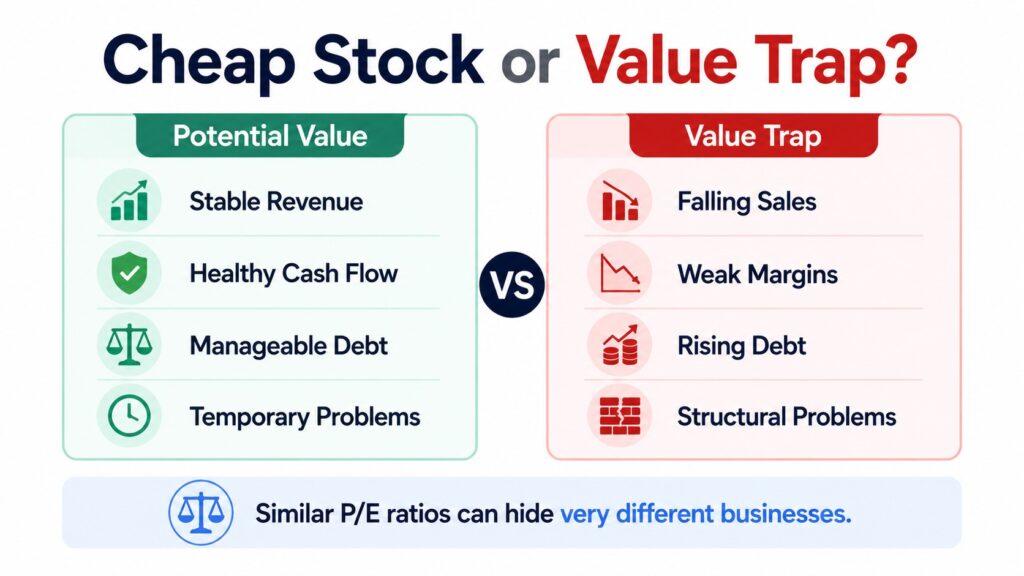
The second company may be a value trap—a stock that appears cheap based on past earnings but remains cheap, or falls further, because the business continues to weaken.
A traditional retailer provides a simple example. Its stock may trade at a low multiple after several years of declining store traffic, but investors may be pricing in a permanent shift toward online shopping rather than a temporary slowdown.
The practical question is not simply:
“How low is the P/E ratio?”
A more useful question is:
“What problem is the market pricing into this stock?”
Until that question has a reasonable answer, the low valuation should be treated as a warning to investigate—not as a buy signal.
Mistake #2: Comparing P/E Ratios Across Unrelated Industries
A low P/E ratio only becomes meaningful when it is compared with an appropriate benchmark.
Technology companies, utilities, banks, consumer businesses, and commodity producers operate under very different conditions. Their growth rates, capital requirements, profit stability, and business risks are not the same.
| Industry | Common P/E Pattern | Why the Market May Value It Differently |
|---|---|---|
| Technology | Often higher | Investors may expect scalable revenue and faster long-term growth |
| Utilities | Often lower | Cash flow may be stable, but growth is usually limited and capital needs are high |
| Banks | Low to moderate | Earnings depend on interest rates, credit quality, and economic conditions |
| Consumer staples | Moderate | Demand is relatively stable, but growth is often slower |
| Commodity producers | Highly cyclical | Profits can rise and fall sharply with oil, metals, or agricultural prices |
These are broad tendencies, not fixed valuation rules. Actual P/E ratios change with interest rates, profitability, growth expectations, and market conditions.
Comparing a utility company directly with a semiconductor company can create a false sense of cheapness.
A better starting point is to compare companies with:
- similar business models;
- similar growth rates;
- similar capital requirements;
- similar geographic exposure;
- similar industry risks.
Even within the same industry, the lower-valued company is not automatically the better investment. It may have weaker margins, more debt, slower growth, poorer capital allocation, or a less competitive product.
The better question is whether the valuation difference is justified by differences in business quality and future earnings potential.
Mistake #3: Ignoring Why Earnings Are High
One of the most dangerous P/E mistakes appears in cyclical industries.
Examples include:
- oil producers;
- steel companies;
- shipping businesses;
- automakers;
- semiconductor manufacturers;
- commodity-related companies.
These businesses can experience large changes in earnings as supply, demand, and product prices move through a cycle.
Near the top of a business cycle, profits may be unusually strong.
That can make the P/E ratio look surprisingly low.
Imagine a commodity producer whose earnings rise sharply because the price of its main product temporarily increases. If earnings rise faster than the share price, the stock’s P/E ratio may fall.
The stock appears cheaper, even though the company may be close to peak profitability.
If commodity prices later return to normal, earnings can decline quickly. The apparently low P/E ratio was based on profits that could not be sustained.
This creates a counterintuitive situation:
A cyclical stock may look cheapest when its earnings are near a peak.
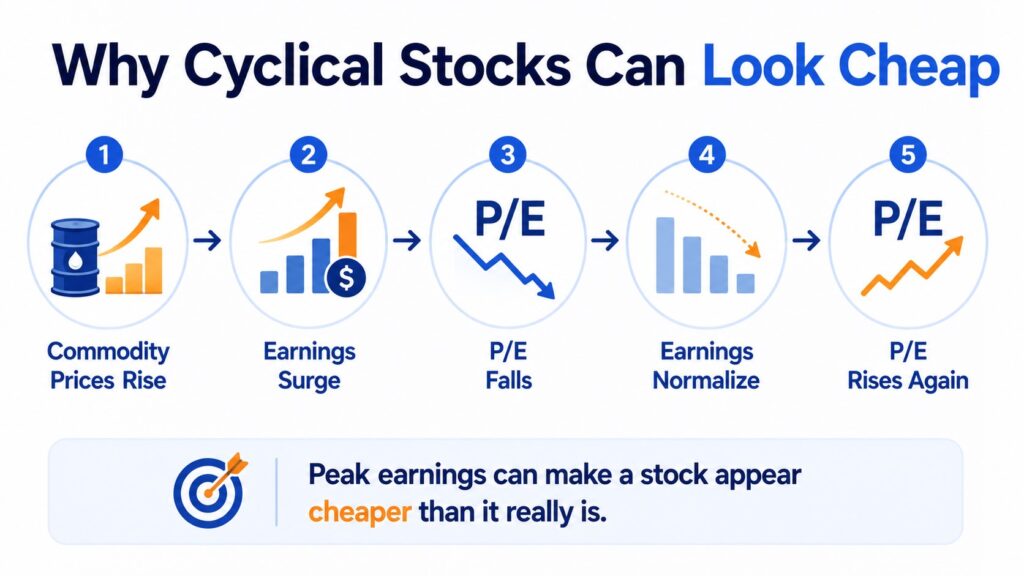
It may also look expensive when earnings are temporarily depressed near the bottom of the cycle.
When I review a cyclical company, I find it more useful to ask:
- Are current earnings normal?
- Are they unusually high?
- Are profit margins above their historical range?
- Have product prices recently risen sharply?
- Is new supply entering the industry?
- What would earnings look like under more normal conditions?
A single year of earnings may not represent the company’s true earning power.
A Simple Example of How a Low P/E Can Mislead
Suppose a stock trades at $50 and currently earns $5 per share.
Its P/E ratio is:
$50 ÷ $5 = 10
A P/E of 10 may look inexpensive.
Now assume the company is in a cyclical industry and its earnings fall by 30% as market conditions return to normal.
Earnings per share would decline from $5 to $3.50.
If the share price remains at $50, the new P/E ratio becomes:
$50 ÷ $3.50 = 14.3
The stock did not become more expensive because its price increased. It became more expensive because its earnings declined.
This is why I try to test a low-P/E stock under less favorable earnings assumptions.
If a stock only looks cheap when profits are at record levels, the apparent discount may disappear as soon as earnings return to normal.
Mistake #4: Looking at P/E Without Checking Business Quality
The P/E ratio says very little about the financial health of a business.
It does not directly tell you:
- whether revenue is growing;
- whether operating margins are improving;
- whether cash flow supports reported earnings;
- how much debt the company carries;
- whether management allocates capital effectively;
- whether the company still has a competitive advantage.
Two companies can report similar earnings today while having very different futures.
Business Quality Matters More Than the Current Multiple
One may be investing successfully in new products and expanding its customer base. The other may be cutting costs to protect short-term earnings while revenue continues to decline.
The P/E ratio may not reveal that difference.
This is especially important when comparing mature companies with faster-growing competitors.
A mature semiconductor company with flat revenue, heavy capital spending, and execution concerns may deserve a lower valuation than a competitor with expanding margins, stronger demand, and faster earnings growth.
That does not mean the higher-P/E company is automatically the better investment. It means the market is pricing future expectations, not just current earnings.
A low-P/E company with declining profits can be more expensive than it appears, while a higher-P/E company may become less expensive over time if earnings grow faster than the share price.
Before deciding that a low P/E ratio represents value, I check whether the underlying business is stable enough to protect those earnings.
Mistake #5: Using One Fixed “Good P/E” Number
There is no universal P/E ratio that makes a stock attractive.
A P/E of 12 may be reasonable for one company and risky for another.
A P/E of 30 may be excessive for a slow-growing business but understandable for a company with strong and durable earnings growth.
The appropriate valuation depends on factors such as:
- expected earnings growth;
- business stability;
- interest rates;
- debt levels;
- competitive position;
- industry conditions;
- investor expectations.
Interest rates are particularly important.
When interest rates rise, bonds and other lower-risk assets become more attractive, while future corporate earnings are discounted more heavily. As a result, investors may become less willing to pay high valuation multiples, especially for companies whose profits are expected far in the future.
When rates are lower and economic growth is strong, the market may accept higher P/E ratios.
This is why I consider a company’s current P/E ratio alongside:
- its own historical valuation range;
- valuations of direct competitors;
- expected earnings growth;
- current interest rates;
- the company’s financial condition;
- current business and industry conditions.
A P/E number without context is not enough to determine whether a stock is cheap.
My Practical Low P/E Ratio Screening Routine
When I review a stock with a low P/E ratio, I do not begin by deciding that it is undervalued.
I begin by looking for the reason behind the discount.
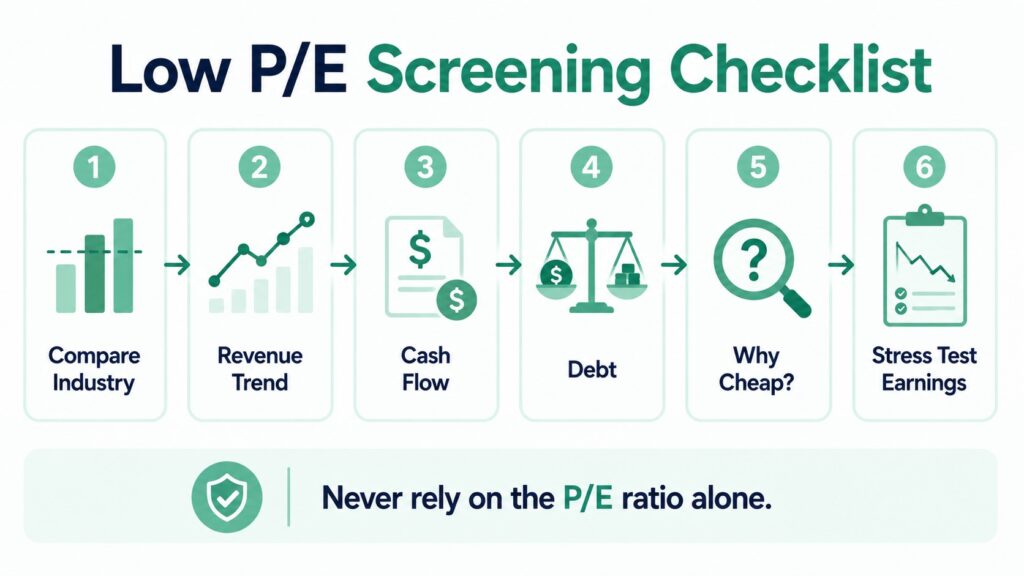
1. Compare the Company With Its Industry
First, I compare the company with direct competitors rather than the entire stock market.
I check whether the businesses have similar products, customers, growth rates, geographic exposure, and capital requirements.
If one company trades at a much lower P/E ratio, I try to identify what explains the difference.
The discount may be justified by weaker margins, more debt, slower growth, or greater business risk.
2. Review at Least Three Years of Revenue and Operating Income
One strong year can distort a P/E ratio.
I review at least three years of revenue, operating income, operating margins, and earnings per share.
I want to know whether current earnings reflect a stable trend or a temporary boom.
If earnings have risen sharply while revenue has barely changed, I investigate whether the improvement came from temporary pricing, cost reductions, asset sales, or accounting effects.
I verify these changes in the company’s annual 10-K and quarterly 10-Q filings.
3. Check Operating Cash Flow
Reported net income is more convincing when the company is also generating cash from its normal business activities.
The SEC’s Beginner’s Guide to Financial Statements explains that the income statement, balance sheet, and cash flow statement each provide a different view of a company’s financial condition.
I compare net income with operating cash flow, capital expenditures, and free cash flow.
If net income is rising while operating cash flow is consistently weak, the quality of the reported earnings may require closer examination.
Cash flow does not replace earnings analysis, but it can reveal whether profits are being converted into actual cash.
4. Review Debt in Context
I avoid using one debt-to-equity threshold for every company.
Banks, utilities, real estate companies, and capital-intensive manufacturers naturally operate with different debt structures.
Instead, I ask:
- Can recurring cash flow comfortably cover interest payments?
- Is net debt increasing?
- Does the company have major debt maturities approaching?
- Would weaker earnings make the debt burden harder to manage?
- How does its leverage compare with direct competitors?
The goal is not to find a debt-free company, but to determine whether it can manage its obligations under less favorable conditions.
5. Identify the Reason for the Low Valuation
I try to explain the discount in one sentence.
For example:
“The stock is trading at a low P/E ratio because investors expect margins to decline as competition increases.”
Another example might be:
“The company appears cheap because current earnings are unusually high after a temporary increase in commodity prices.”
Writing the reason in one sentence forces me to separate a genuine investment thesis from a vague feeling that the stock looks cheap.
If I cannot explain why the market is assigning a low valuation, I assume more research is needed.
6. Test the Earnings
Finally, I calculate what the valuation would look like if earnings declined.
For cyclical or economically sensitive companies, I may test what happens if earnings decline by 10%, 20%, or 30%.
I also consider what earnings might look like if operating margins returned closer to their historical average.
This simple test can reveal whether the investment still appears reasonably valued under normal conditions.
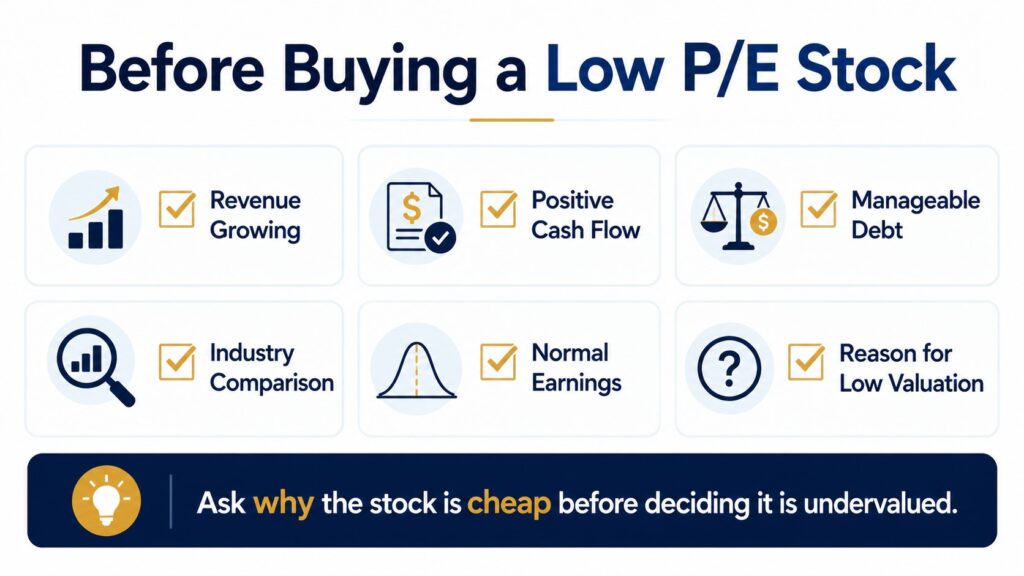
A Simple Low P/E Ratio Checklist
Before treating a low-P/E stock as a possible value opportunity, check the following questions.
Business Performance
- Is revenue stable or growing?
- Are operating margins holding up?
- Is the company maintaining market share?
- Are current earnings unusually high?
Earnings Quality
- Does operating cash flow support net income?
- Are profits dependent on temporary pricing?
- Have one-time gains increased reported earnings?
- Is free cash flow consistently positive?
Financial Risk
- Is debt manageable?
- Can the company cover interest payments?
- Are major debt maturities approaching?
- Would a recession or industry slowdown create financial pressure?
Valuation Context
- How does the P/E compare with direct competitors?
- How does it compare with the company’s own historical range?
- What risk is the market pricing in?
- What happens to the P/E ratio if earnings fall?
This checklist will not identify perfect investments.
Its purpose is to prevent one attractive-looking number from replacing a complete analysis.
Final Thoughts
A low P/E ratio is not a buy signal.
It is a reason to investigate why the market is assigning the company a discount.
The key distinction is between a business facing a temporary problem and one whose long-term earnings power is permanently weakening. Both can appear cheap, but their future outcomes may be very different.
Before treating a low-P/E stock as undervalued, check its revenue trend, operating margins, cash flow, debt, industry cycle, competitive position, and normalized earnings.
Then consider how the valuation would change if earnings returned to a more normal level.
The rule I use is simple:
Always ask why the stock looks cheap—not just how cheap it looks.
That question leads to a much better investment process than sorting a stock screener from the lowest P/E ratio to the highest.
FAQ
Q1. Is a Low P/E Ratio Always Good?
No. A low P/E ratio may indicate undervaluation, but it can also reflect declining earnings, weak growth, high debt, industry risks, or serious problems within the business.
Q2. What Is Considered a Low P/E Ratio?
There is no universal level. A P/E ratio should be compared with the company’s industry, historical valuation range, growth rate, financial condition, and current interest-rate environment.
Q3. Can a Stock With a High P/E Ratio Still Be Attractive?
Possibly. A higher valuation may reflect expectations for strong future earnings growth. The important question is whether that expected growth is realistic, profitable, and sustainable.
Q4. Why Do Cyclical Stocks Sometimes Have Very Low P/E Ratios?
Their earnings may be near a temporary peak. If profits later return to normal, the stock may not be as cheap as the current P/E ratio suggests.
Q5. Is Forward P/E Better Than Trailing P/E?
Not always. Trailing P/E uses actual past earnings, while forward P/E uses estimated future earnings. Forward P/E can be more useful for changing businesses, but forecasts may be inaccurate, so it is best to compare both.
Q6. Can a Company Have a Negative P/E Ratio?
When a company reports a net loss, a meaningful P/E ratio usually cannot be calculated. Financial websites may display the ratio as negative or show “N/A.”
In this situation, investors may consider other metrics such as revenue growth, cash flow, price-to-sales ratio, or expected future profitability.
📚 Related Articles
Fundamental Analysis for Beginner Investors: A Smart Guide to Better Stock Decisions
How to Read Financial Statements: A Simple Beginner’s Guide
What Is a Stock? A Simple and Effective Beginner’s Guide
How U.S. Treasury Yields Affect Tech Stocks: A Smart and Powerful Beginner’s Guide

Market Capitalization Explained: The Costly Mistake Beginner Investors Make
Market capitalization is one of the first numbers investors see when researching a stock. It…

Why Stocks Rise on Bad News: What Beginner Investors Should Know
Many beginner investors wonder why stocks rise on bad news, especially when the headlines seem…

How to Build Your First Stock Portfolio: A Smart and Simple Beginner’s Guide
Learning how to build your first stock portfolio can feel more complicated than it needs…
Disclaimer: This article is for educational purposes only. It is not financial advice or a recommendation to buy or sell any specific stock, ETF, cryptocurrency, or other asset. All investment decisions are your own responsibility.