

Fundamental Analysis for Beginner Investors is not about memorizing accounting terms.
It is about learning how to look at a business before reacting to a stock price.
When I first started investing, I often checked stock prices before understanding the business. Over time, I realized that price movement alone did not tell me whether a company was actually healthy or simply popular.
Many beginners start with headlines, price charts, social media posts, or a stock that is suddenly trending. That is understandable. The market moves fast, and popular stocks often feel more exciting than financial statements.
But a stock is not just a ticker symbol.
It represents a real business with sales, costs, debt, cash flow, competitors, and expectations. Fundamental analysis helps you slow down and ask a better question:
Is this company actually becoming a stronger business, or is the stock only moving because of short-term excitement?
This article is for educational purposes only, not personal investment advice.
Fundamental Analysis for Beginner Investors: What It Really Means
Fundamental analysis is the process of evaluating a company based on its business quality, financial health, growth potential, and valuation.
A simple way to think about it is this:
You are trying to understand the company behind the stock.
For example, a beginner might see Nvidia in the news and think, “AI is growing, so this stock must be a good investment.” But a more careful investor would ask different questions.
Is revenue actually growing?
Are margins improving?
Is the company generating strong free cash flow?
Is the current valuation already pricing in years of future growth?
That difference matters.
The goal is not to predict the next daily price move. The goal is to avoid buying a stock only because it is popular.
Why Fundamental Analysis Matters for Beginner Investors
The stock market often rewards stories in the short term.
Artificial intelligence, electric vehicles, cloud computing, Bitcoin, and interest rate expectations can all create powerful narratives. Sometimes those stories are backed by strong business results. Sometimes they are not.
This is where fundamental analysis becomes useful.
It gives you a filter.
For example, Tesla may move sharply because of delivery expectations, margins, competition, or comments from management. Nvidia may move because of AI demand and data center growth. SPY and QQQ may react to interest rates, earnings expectations, and Federal Reserve policy.
The beginner mistake is assuming that a rising stock is always a strong business.
That is not always true.
Sometimes a stock rises because investors are excited. Sometimes a good company becomes too expensive. Sometimes a weak company rallies for a few weeks because of market momentum.
When I look at a stock, I usually ask one simple question first:
Can I explain how this company makes money, why profits may grow, and what could go wrong in under three minutes?
If I cannot explain that clearly, I probably do not understand the business well enough yet.
Fundamental Analysis for Beginner Investors: The Three Financial Statements to Know
You do not need to become an accountant to start.
But you should understand the three basic financial statements.
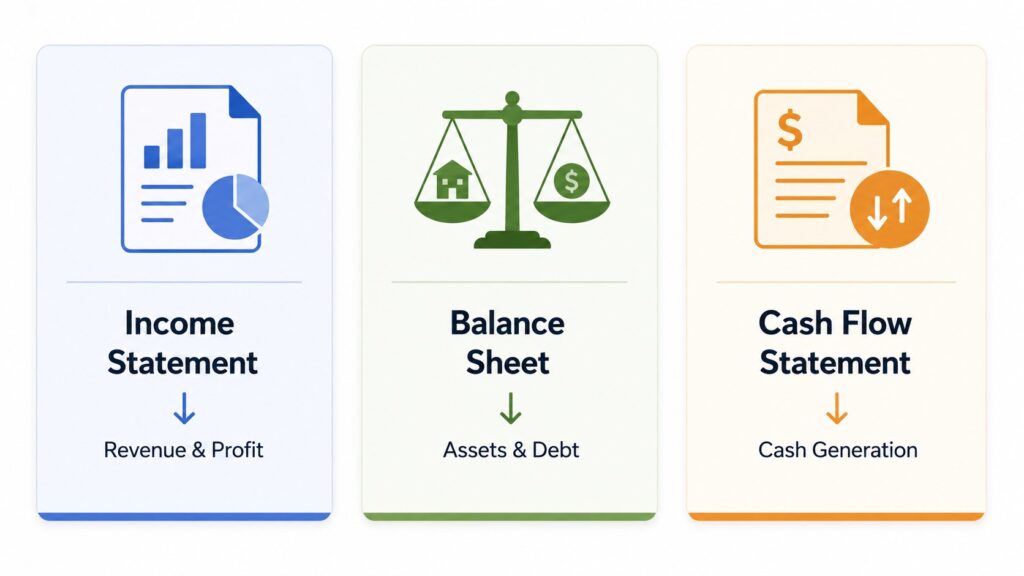
Income Statement
The income statement shows revenue, expenses, and profit.
Revenue tells you how much the company sells. Net income shows what remains after costs and other expenses.
For beginners, the key question is not only whether revenue is growing.
The better question is:
Is the company turning growth into profit?
A company can grow sales quickly but still lose money. That may be acceptable for some young growth businesses, but it needs a clear explanation.
Balance Sheet
The balance sheet shows what the company owns and owes.
This includes cash, debt, assets, and liabilities.
A strong balance sheet gives a company more flexibility when the economy weakens or interest rates rise. A company with too much debt may struggle if profits fall or borrowing costs increase.
This is especially important during uncertain markets.
When conditions get harder, companies with weak balance sheets often have less room for mistakes.
Cash Flow Statement
The cash flow statement shows how much real cash the business generates.
This matters because accounting profits and actual cash are not always the same.
Free cash flow is especially useful. It shows how much cash may remain after the company spends money to maintain or grow the business.
In my own routine, I pay close attention to cash flow because it is harder to “decorate” than a growth story.
A company that consistently generates cash usually has more options. It can reinvest, reduce debt, buy back shares, or pay dividends.
Investors who want to learn more about cash flow statements can review the educational resources provided by the U.S. Securities and Exchange Commission.
Key Metrics for Fundamental Analysis for Beginner Investors
Metrics are helpful, but no single metric tells the full story.
Here is a practical beginner table.
| Metric | What It Tells You | Beginner Caution | My Quick Filter |
|---|---|---|---|
| Revenue Growth | Whether sales are increasing | Growth without profit can be risky | Check whether growth is consistent, not just one strong quarter |
| Profit Margin | How much profit remains from sales | Margins differ by industry | Compare margins with competitors |
| EPS | Earnings per share | Can be affected by buybacks | Look at the trend, not one number |
| P/E Ratio | Price compared with earnings | Low P/E does not always mean cheap | Compare with growth and industry average |
| Debt-to-Equity | Debt compared with equity | Some industries use more debt | Ask whether debt is manageable |
| Free Cash Flow | Cash left after business spending | Negative cash flow needs explanation | Prefer businesses with improving cash flow |
The P/E ratio is one of the most misunderstood metrics.
A low P/E stock may look cheap, but it can also be a value trap. That means the stock looks inexpensive, but the business may be slowing down for a serious reason.
A high P/E stock may look expensive, but it may reflect strong expected growth.
So the better question is not “Is the P/E low?”
The better question is:
Does the valuation make sense compared with growth, profitability, and business quality?
For a deeper explanation of valuation metrics, the Investopedia guide on the P/E ratio is a useful starting point.
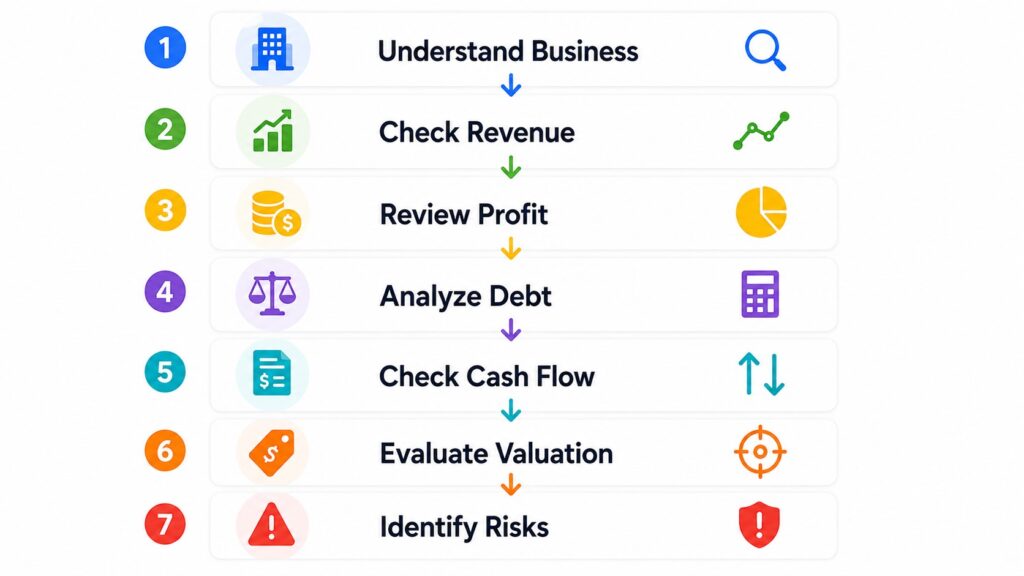
A Simple Stock Evaluation Routine
Beginners often overcomplicate fundamental analysis.
You do not need a huge spreadsheet at first. A simple routine is better than random checking.
My simple routine is this: first, I try to understand the business. Then I check revenue, margins, debt, cash flow, and valuation. Finally, I write down one reason the stock could disappoint me.
That last step is important.
Many beginners only write down why a stock could go up. But useful analysis also includes what could go wrong.
Competition, regulation, lower demand, higher costs, margin pressure, and rising interest rates can all change the investment story.
Example: Applying Fundamental Analysis to a Real Company
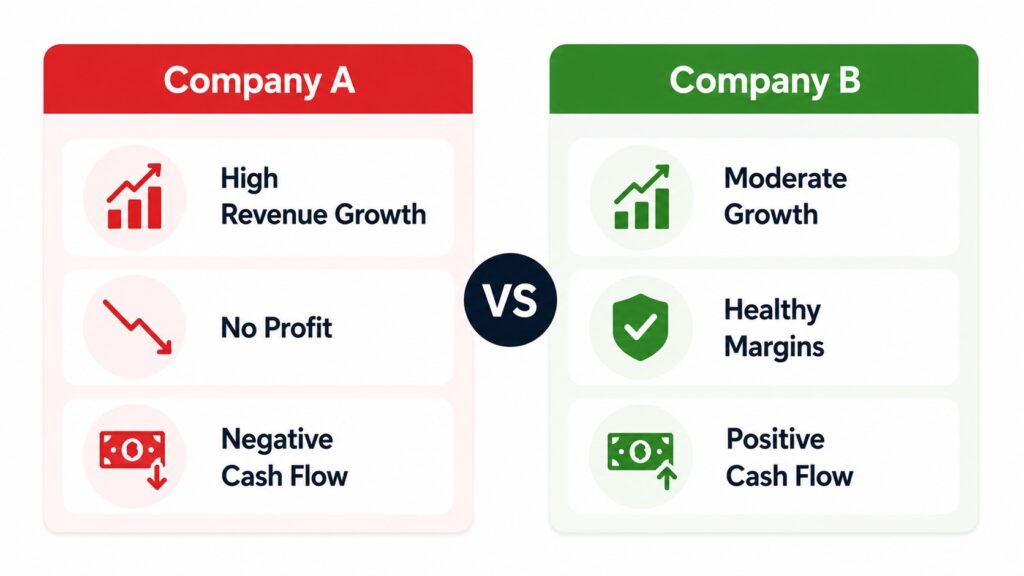
Imagine two companies.
Company A grows revenue by 30% per year but generates no profit and negative cash flow.
Company B grows revenue by 10% per year, maintains healthy margins, and generates consistent free cash flow.
Many beginners immediately prefer Company A because the growth rate looks impressive. Fundamental analysis encourages a deeper look.
Depending on valuation, debt levels, and future expectations, Company B could actually be the safer long-term investment.
The goal is not to find the fastest-growing company.
The goal is to find a business whose fundamentals justify its valuation.
Common Beginner Mistakes
The first mistake is buying a stock because the company is famous.
A famous company is not automatically a good investment at any price.
The second mistake is relying on only one metric.
Some beginners look only at P/E. Others look only at revenue growth. Some focus only on whether a company is profitable.
Good analysis connects the pieces.
The third mistake is ignoring the industry.
A software company, bank, retailer, semiconductor company, and utility should not be judged by the exact same standards.
The fourth mistake is forgetting interest rates.
When interest rates rise, investors often become less willing to pay high prices for future growth. This can pressure growth-heavy stocks and ETFs such as QQQ, even when many companies remain fundamentally strong.
The fifth mistake is confusing a good company with a good stock.
A company can be excellent, but the stock can still be too expensive if expectations are already extremely high.
My Personal Rule of Thumb
If I cannot explain how a company makes money, why earnings may grow, and why the current valuation makes sense, I do not treat it as an investment idea yet.
It may still be a great company. It may even keep rising. But if I cannot explain the business clearly, I am probably reacting to price movement rather than doing analysis.
This simple rule helps beginners avoid chasing every hot stock.
It also creates discipline.
The goal is not to be perfect. The goal is to make fewer emotional decisions.
If you are new to stock research, you may also want to learn how to read financial statements before evaluating individual companies.
Practical Investor Takeaway
Fundamental analysis is not about predicting tomorrow’s stock price.
It is about understanding the business behind the stock.
For beginner investors, the best starting point is simple:
Look for companies you can understand, with improving revenue, healthy margins, manageable debt, strong or improving cash flow, and a valuation that makes sense compared with growth.
Avoid buying only because a stock is trending.
A practical checklist can protect you from emotional decisions:
- Do I understand how the company makes money?
- Is revenue growing?
- Are profits or margins improving?
- Is debt manageable?
- Does the company generate cash?
- Is the valuation reasonable?
- What could go wrong?
Understanding valuation becomes much easier when you also understand how interest rates affect stock prices.
Final Thoughts
Looking back, one of the biggest investing mistakes I made was spending more time watching stock prices than understanding the businesses behind them.
Fundamental analysis did not help me predict every market move, but it helped me make more informed decisions and avoid chasing every popular stock.
That is the real value of this framework.
It gives beginner investors a way to slow down, compare businesses more carefully, and think beyond daily price movement.
No single metric can answer everything.
But when you combine business understanding, revenue, profit, debt, cash flow, valuation, and market context, you get a clearer picture.
That does not remove risk. But it can help you invest with more discipline and less emotion.
Before buying any stock, remember that even strong companies can become poor investments if expectations are too high. Fundamental analysis is not about finding certainty. It is about making better decisions with the information available.
❓ FAQ
Q1. Does a low P/E mean a stock is a bargain?
Not always. A low P/E can mean a stock is undervalued, but it can also be a value trap if the business is slowing down.
Q2. Can I use fundamental analysis for growth stocks?
Yes. For growth stocks, focus on revenue growth, margins, cash flow trends, and whether the valuation already reflects too much optimism.
Q3. What is the most beginner-friendly financial metric?
Revenue growth is easy to understand, but it should not be used alone. Beginners should also check profit, debt, and free cash flow.
Q4. Is fundamental analysis useful for ETFs?
Yes, but in a different way. For ETFs like SPY or QQQ, investors usually look at the major holdings, sector exposure, valuation, earnings trends, and macro conditions.
Q5. Can fundamental analysis predict stock prices?
No. It cannot predict short-term price moves. It is better used as a framework for understanding business quality, valuation risk, and long-term expectations.
📚 Further Reading
[Macro Analysis] Interest Rates and the Stock Market: A Beginner’s Practical Guide
[Macro Analysis] Inflation and Stock Investing: A Smart and Essential Beginner’s Guide
[Trading Basics] Trading Volume for Beginners: How to Read It With Price Action

How U.S. Treasury Yields Affect Tech Stocks: A Smart and Powerful Beginner’s Guide
How U.S. Treasury Yields Affect Tech Stocks is one of the most important macro relationships…
Moving Averages in Stocks: The Ultimate Guide to Clear Trend Reading
If you have ever opened a stock chart and noticed smooth lines moving across the…

Inflation and Stock Investing: A Smart and Essential Beginner’s Guide
Inflation and stock investing are closely connected because inflation changes how investors think about earnings,…
Disclaimer: This article is for educational purposes only. It is not financial advice or a recommendation to buy or sell any specific stock, ETF, cryptocurrency, or other asset. All investment decisions are your own responsibility.