
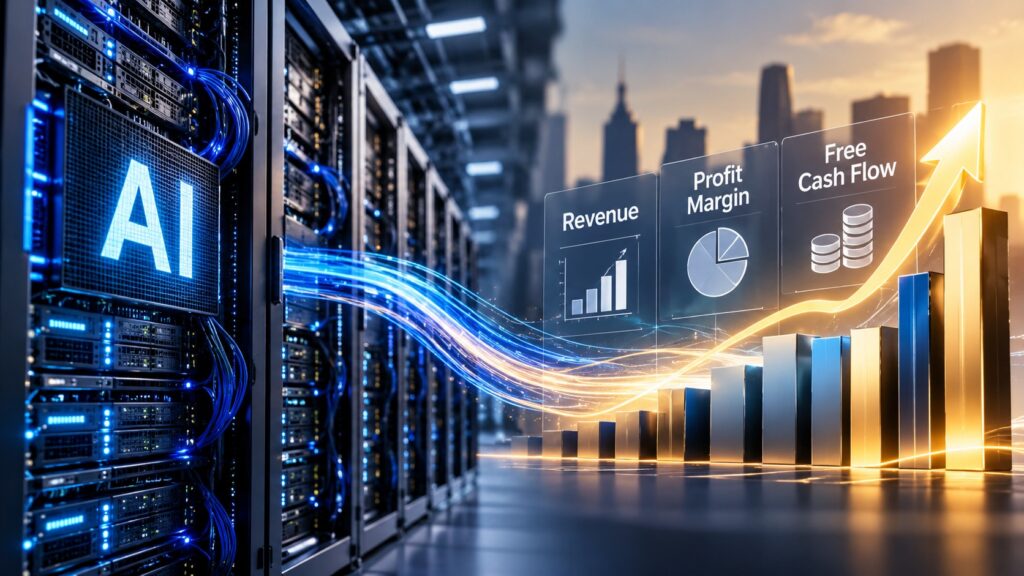
Artificial intelligence is creating new revenue opportunities for Big Tech, but it is also changing the economics behind those revenues.
AI services require expensive chips, data centers, networking equipment, electricity, cooling, and continuous infrastructure investment. That raises an important question for investors: Can Big Tech profit margins remain unusually high as AI usage scales?
What matters is whether the revenue and gross profit generated by additional AI capacity improve fast enough to absorb depreciation, infrastructure operating costs, and the cost of serving more AI workloads.
The five signals that matter most are incremental economics, capacity monetization, depreciation, margin structure, and cash returns.
Together, they provide a better framework than simply asking which company is spending the most on AI.
AI Changes the Economics of Scaling Software
Traditional software can have attractive incremental economics. Once a product has been developed, serving an additional customer may cost relatively little compared with the revenue that customer generates.
Generative AI complicates that model.
When users ask an AI system to generate text, analyze documents, create images, write code, or perform agentic tasks, servers must perform computation. More usage can require more accelerator capacity, memory, networking, electricity, and cooling.
AI growth can therefore increase both revenue and the cost of delivering that revenue.
That does not make AI a bad business. It means revenue growth alone is not enough to judge the economics.
Consider two hypothetical AI products.
Product A adds $10 billion in annual revenue while creating $2 billion in additional costs.
Product B also adds $10 billion in revenue but creates $6 billion in additional costs.
Both companies can announce the same revenue growth. Their incremental economics are very different.
For investors evaluating Big Tech profit margins, the central question is whether each additional dollar of AI-related revenue produces enough additional profit to justify the resources required to generate it.
1. Start With Gross Margin—but Look at Incremental Margin Too
Gross margin shows how much revenue remains after the costs associated with delivering a company’s products and services. For investors tracking Big Tech profit margins, it can provide an early signal of AI infrastructure pressure.
Microsoft’s fiscal 2026 fourth quarter results offer a useful example. The company reported revenue of $90.0 billion, up 18% year over year. Company gross margin percentage was 67%, down from the prior year.
Management attributed the decline partly to a sales mix shift toward Azure and continued investment in AI infrastructure and growing product usage, while noting that efficiency gains provided a partial offset.
Microsoft Cloud gross margin was 65%, also down year over year. Yet company gross profit dollars still increased.
That distinction matters because a falling margin percentage does not automatically mean the business is generating less profit.
Consider this simplified hypothetical example:
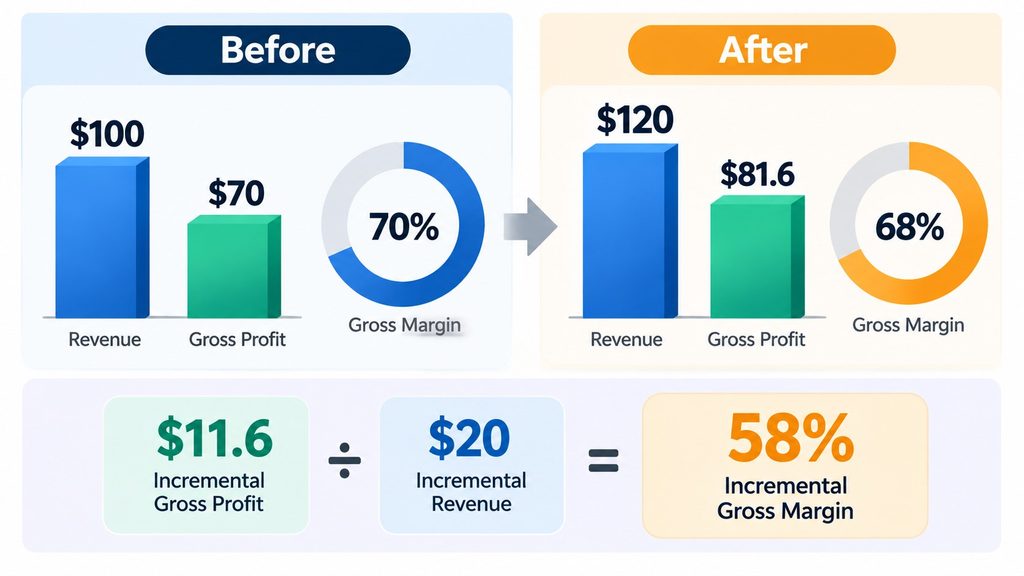
| Metric | Before Expansion | After Expansion | Incremental Change |
|---|---|---|---|
| Revenue | $100.00 | $120.00 | +$20.00 |
| Gross Margin | 70.0% | 68.0% | -2.0 percentage points |
| Gross Profit | $70.00 | $81.60 | +$11.60 |
| Incremental Gross Margin | — | — | 58.0% |
The company added $20 of revenue and $11.60 of gross profit. That means the additional revenue generated a hypothetical incremental gross margin of:
$11.60 ÷ $20.00 = 58%
Reported margin and incremental margin are not the same thing. In this example, the new revenue remains profitable but carries a lower margin than the existing business, increasing total gross profit while pulling the companywide margin lower.
Companies rarely disclose enough information to calculate AI incremental margins precisely. Investors can still monitor the direction through gross-margin trends, pricing changes, infrastructure efficiency, utilization, and management commentary.
What to watch: Compare the additional revenue created by AI with the additional gross profit it produces. Revenue growth is less impressive if incremental profitability keeps weakening.
2. Track Whether AI Capacity Is Being Monetized Quickly
Expensive infrastructure is easier to justify when new capacity can be converted into revenue quickly. That makes the speed of monetization an important factor when evaluating Big Tech profit margins.
Microsoft provided a useful example in its fiscal 2026 fourth-quarter earnings commentary. Management said Azure demand continued to exceed available capacity and that efficiency improvements allowed additional capacity to come online during the quarter. According to the company, that additional Azure capacity was quickly monetized.
Microsoft also said GitHub Copilot margins improved through the quarter following a June business-model change to usage-based pricing, while consumption was stronger than expected.
These disclosures illustrate two paths toward stronger AI economics.
The first is infrastructure utilization. If expensive computing capacity can be filled with paying workloads quickly, infrastructure costs are spread across more revenue.
The second is pricing architecture. If heavier AI usage creates higher costs, pricing that better reflects usage or customer value can help protect margins.
AI user growth by itself is therefore not enough. Rapid usage growth can be attractive when monetization keeps pace, but the same growth can create margin pressure when customers consume expensive computing resources without generating sufficient additional revenue.
What to watch: Capacity, usage, and monetization should move together. Rapid AI usage growth deserves closer scrutiny when expensive computing consumption rises faster than the revenue it generates.
3. Watch AI CAPEX and Depreciation Together
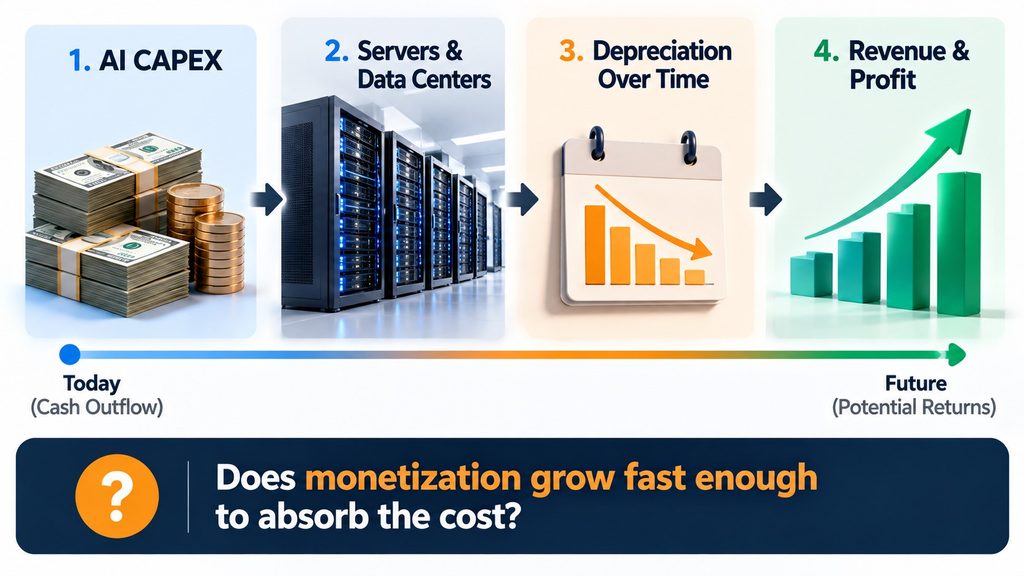
One reason AI profitability can be difficult to interpret is the timing difference between capital expenditures and accounting expenses.
When a company purchases servers or builds data-center infrastructure, much of that spending is capitalized rather than immediately recorded as an expense on the income statement. The cost is then recognized over time, including through depreciation.
That creates two financial stages:
Stage 1: Cash is committed to servers, data centers, and other infrastructure.
Stage 2: Part of that investment appears as depreciation expense over future periods.
Meta’s second-quarter 2026 results show why this deserves attention.
The company reported $31.08 billion of capital expenditures, including principal payments on finance leases. Depreciation and amortization was approximately $6.36 billion, compared with about $4.34 billion a year earlier.
Rising depreciation is not automatically a negative signal. If the infrastructure behind that depreciation produces rapidly growing revenue and profit, the company may be earning an attractive return on its investment.
If depreciation rises while monetization grows faster, the additional expense may be manageable. If depreciation continues climbing while revenue growth, utilization, or monetization disappoints, the same infrastructure becomes a heavier burden on future earnings.
This lag is one reason investors should not judge Big Tech profit margins from a single quarter. Today’s AI CAPEX can influence tomorrow’s income statement.
What to watch: Compare depreciation growth with the revenue and gross profit generated by the assets behind it.
4. Compare Gross Margin With Operating Margin
Gross margin and operating margin answer different questions.
Gross margin provides information closer to the economics of delivering products and services. Operating margin also incorporates expenses such as research and development, sales and marketing, and general corporate costs.
Comparing the two can help investors understand whether pressure on Big Tech profit margins is concentrated in the cost of delivering AI services or is spreading more broadly through the business.
In Microsoft’s fiscal 2026 fourth quarter, company gross margin percentage declined year over year, partly because of AI infrastructure investment and growing product usage. Yet operating margin increased slightly to 45%.
Those results can coexist because several forces are operating at the same time:
Higher AI infrastructure and usage costs → pressure on gross margin
while
Revenue growth + slower growth in some operating expenses → support for operating margin
However, corporate efficiency cannot permanently compensate for poor AI unit economics. Over time, AI products and workloads themselves need to generate sufficient economic value.
What to watch: If gross margin falls but operating margin remains resilient, check whether genuine operating leverage is offsetting AI infrastructure costs. If both weaken persistently, the underlying economics deserve closer examination.
5. Use Free Cash Flow as a Reality Check
Reported earnings do not capture the full cash burden of a large infrastructure buildout in the same period. Free cash flow therefore provides an important reality check when assessing Big Tech profit margins and the investment required to sustain them.
Amazon’s second-quarter 2026 results illustrate the difference.
AWS revenue grew 37% year over year to $42.2 billion, while AWS operating income increased to $16.6 billion from $10.2 billion a year earlier.
At the same time, Amazon reported trailing-12-month free cash flow of negative $7.6 billion, compared with positive $18.2 billion for the previous comparable period.
Amazon said the decline was driven primarily by a $66.1 billion year-over-year increase in purchases of property and equipment, net of proceeds from sales and incentives, largely reflecting AI investment.
These figures do not prove that the investment is succeeding or failing. Instead, they reveal two parts of the same economic story: AWS was producing substantially more operating income while Amazon was also committing enormous amounts of capital to future infrastructure.
A decline in free cash flow caused by productive investment is different from a decline caused by deterioration in the underlying business. But productive investment eventually needs to generate adequate future cash returns.
What to watch: Falling free cash flow deserves more concern when heavy infrastructure investment fails to produce stronger future operating cash flow.
A 5-Signal Framework for Evaluating Big Tech Profit Margins
A practical way to judge AI economics is to compare monetization with the full cost of capacity: infrastructure spending, depreciation, inference costs, and the cash flow those assets eventually generate.
Investors cannot usually calculate a clean “AI return on investment” from public financial statements. AI revenue and costs can be spread across cloud services, software products, advertising systems, research expenses, and shared infrastructure.
Instead of searching for one perfect metric, investors can compare five signals:
| Signal | What to Compare | What Deserves Closer Scrutiny |
|---|---|---|
| Incremental economics | Added revenue vs. added gross profit | Revenue grows while incremental profitability weakens |
| Capacity monetization | New capacity vs. paying workloads | Capacity expands faster than monetized demand |
| Depreciation | Depreciation vs. revenue and gross-profit growth | Depreciation persistently outgrows monetization |
| Margin structure | Gross margin vs. operating margin | Both weaken without a clear temporary explanation |
| Cash returns | Infrastructure investment vs. future operating cash flow | Heavy investment fails to improve future cash generation |
The signals matter most when viewed together.
Why One Quarter Can Give the Wrong Impression
Meta’s second-quarter 2026 results demonstrate why margin analysis requires context.
Revenue increased 28% year over year to $60.80 billion, while operating margin declined from 43% to 31%.
It would be tempting to interpret the decline as evidence that AI infrastructure was damaging profitability.
But the quarter also included $2.40 billion of charges related to legal proceedings and $1.18 billion of severance expenses. Those items materially affected reported expenses.
At the same time, investors should not ignore the underlying infrastructure trend. Meta’s depreciation and amortization increased from roughly $4.34 billion to $6.36 billion year over year, while quarterly capital expenditures exceeded $31 billion.
The quarter therefore contains three different economic effects:
- Unusual or non-recurring expenses
- Structural infrastructure costs
- Potential revenue and efficiency benefits from AI
Combining them into a single explanation would produce a misleading conclusion.
What to watch: When Big Tech profit margins change sharply, separate temporary expenses from structural infrastructure costs and potential future benefits before drawing a conclusion.
AI Can Defend Margins as Well as Pressure Them
AI infrastructure does not affect profitability through costs alone. Several forces can improve the economics as usage scales:
- Higher utilization: Spreads infrastructure costs across more revenue-producing workloads.
- Custom chips: Can improve performance per dollar for specific workloads.
- Model and software efficiency: Can reduce the computing resources required to perform a task.
- Better pricing: Can align customer usage or value more closely with the cost of delivering AI services.
Together, these forces can help protect Big Tech profit margins even while AI infrastructure spending remains elevated.
AI can also improve an existing business rather than generate revenue only through standalone subscriptions. Better recommendations or ad performance can create value inside an advertising business. AI can attract additional workloads to a cloud platform, while software companies may use AI features to support higher revenue per customer or deeper product usage.
The balance investors are ultimately evaluating is:
AI monetization + efficiency gains + operating leverage
versus
infrastructure costs + depreciation + inference costs + continued investment
The Bottom Line
A lower reported margin can coexist with substantial value creation when new AI revenue remains profitable. Conversely, strong revenue growth can be less attractive if infrastructure and operating costs rise even faster.
That is why investors assessing Big Tech profit margins should consider incremental economics, capacity monetization, depreciation, margin structure, and cash returns together rather than relying on any single AI spending number.
For investors, the key question is not how much Big Tech spends on AI, but whether each new dollar of AI investment eventually produces enough revenue, gross profit, and cash flow to justify the capital required.
FAQ
Q1. Why can AI investment hurt free cash flow before earnings?
Large infrastructure purchases can consume cash when the investment is made, while capitalized assets generally affect reported earnings over time through depreciation. A major AI buildout can therefore put immediate pressure on free cash flow even when operating income remains strong.
Q2. What is the most useful sign that AI economics are improving?
There is no single definitive metric. A stronger pattern would include improving monetization of new capacity, healthy incremental gross profit, manageable depreciation growth, resilient operating margins, and eventual improvement in cash generation relative to infrastructure investment.
This article is for educational purposes only and does not constitute personalized investment advice. Financial results and investment outcomes can change. Investors should review current company filings and consider their own circumstances before making investment decisions.
📚 Related Articles
How Long Can AI Data Center Investment Keep Growing? 5 Signals Beyond CAPEX
AI Power Bottleneck: Will Electricity Matter More Than GPUs?
AI Marginal Cost: Why AI Is More Expensive Than Software

High Interest Rates and the Economy: Why Can Growth Stay Strong?
If high interest rates are supposed to slow the economy, why can consumers keep spending,…

Can AI Become a Monopoly? Where the Real Economic Moats Are
Artificial intelligence appears to have many ingredients that could produce powerful monopolies. Training frontier models…

Free Cash Flow vs Earnings: Why Profits Can Rise While Cash Flow Falls
A company reports higher earnings. Revenue is growing, margins look healthy, and net income reaches…