
American consumers are still booking summer trips, attending concerts, and spending on seasonal events. Retail trends such as “Summerween” also suggest that shoppers remain willing to spend when a purchase feels timely, social, or emotionally rewarding.
But visible spending does not necessarily mean household finances are improving.
Many Americans are paying more for housing, insurance, food, and services while becoming increasingly selective about discretionary purchases. They may protect one vacation or special event, then compensate by choosing cheaper groceries, reducing restaurant visits, or delaying a large household purchase.
That tension sits at the center of US consumer spending 2026.
The latest official data reinforce the need to separate spending from purchasing power. The Bureau of Economic Analysis reported that the PCE price index was 4.1% higher in May 2026 than a year earlier. Meanwhile, the June Consumer Price Index is scheduled for release on July 14, 2026, one day after this article’s analysis date. These timing differences matter because rising nominal spending can partly reflect higher prices rather than stronger real consumption.
The central question is simple:
Is the U.S. consumer truly strong, or are Americans simply adapting to higher prices by becoming more selective about where they spend?
The Summer Spending Paradox

Travel, entertainment, and seasonal shopping can make the consumer economy look stronger than it feels.
People do not usually cut every category at the same time. Instead, they rank purchases by emotional value and urgency. A household might keep its annual vacation while eating out less often, waiting for promotions, or switching from premium brands to store labels.
Americans are still spending, but they are becoming far more selective about where that money goes.
Experiences are often protected because they are difficult to postpone or replace. Everyday products offer more room for compromise. Consumers can change brands, buy smaller quantities, visit discount stores, or wait for a sale without completely giving up the purchase.
This helps explain why travel demand can remain visible while other consumer businesses report cautious shoppers. It is not necessarily a contradiction. Different categories are competing for a limited amount of discretionary income.
When I review consumer data, I try not to treat one crowded airport or one strong retail category as proof of broad financial health. The more useful question is what consumers had to reduce elsewhere to preserve that spending.
What US Consumer Spending 2026 Really Says About Affordability
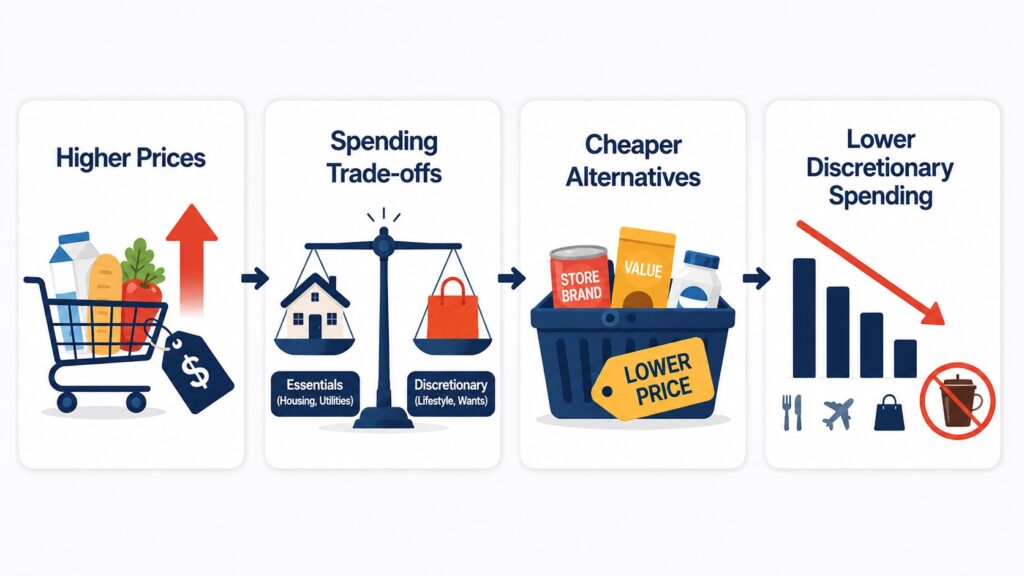
A beginner mistake is assuming that higher spending automatically means people are buying more.
Economists separate nominal consumer spending from real consumer spending. Nominal spending measures the number of dollars spent. Real spending adjusts that amount for inflation.
Imagine that a household’s grocery bill rises from $100 to $110. If the family bought roughly the same basket of products, the additional $10 does not represent a higher living standard. It mostly represents higher prices.
That is why a rise in nominal retail sales or personal consumption expenditures can overstate consumer strength.
Affordability is better understood by looking at how consumers change their behavior:
- They move toward discount retailers, store brands, and lower-priced substitutes.
- They reduce routine discretionary purchases such as casual dining and home goods.
- They selectively preserve travel, entertainment, and family experiences.
- They delay cars, furniture, appliances, or other large purchases.
- Spending gaps widen between households with strong incomes and households with little financial flexibility.
Higher-income consumers may continue spending because they have more savings, investment assets, or income security. Lower- and middle-income households are usually more exposed when rent, debt payments, insurance, utilities, and food take a larger share of monthly income.
The result is a divided consumer economy. Aggregate spending can remain positive even while a meaningful group of households feels worse off.
Early in my investing routine, I paid too much attention to headline retail sales. I later found that real spending, delinquency trends, and company guidance provided a much more useful picture. Dollar growth can look healthy while purchasing power quietly erodes.
Why the Housing Market Still Feels Frozen
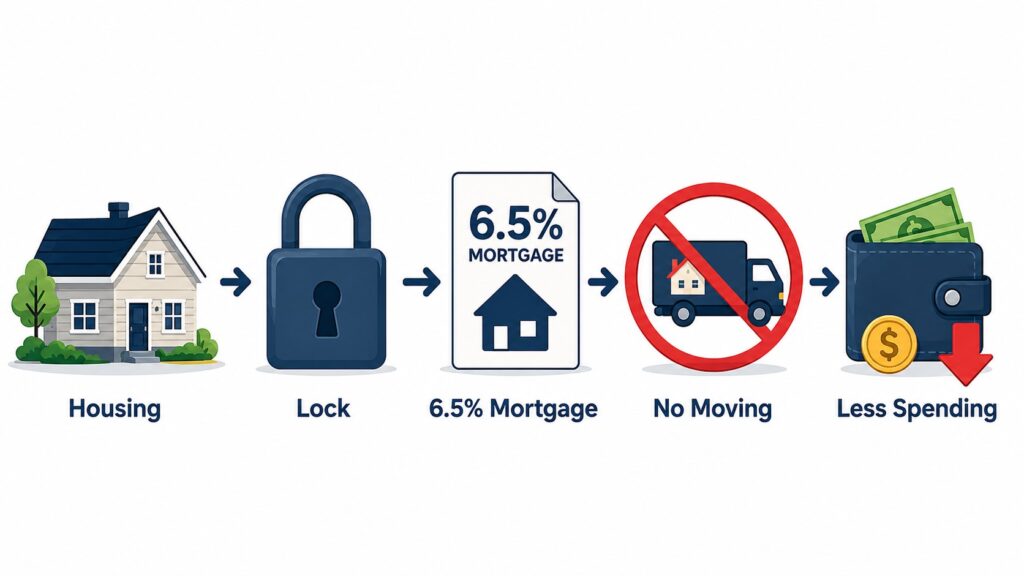
Housing is not a separate problem from consumer spending. It determines how much money households have left after their largest monthly expense.
The mortgage rate lock-in effect begins with homeowners who already have low fixed-rate mortgages. Selling their homes may require taking out a new loan at a much higher rate, increasing the monthly payment even when the replacement home is not significantly better.
So they stay.
Freddie Mac reported that the average 30-year fixed mortgage rate was 6.49% on July 9, 2026. At that level, replacing an older low-rate mortgage can be financially unattractive for many existing homeowners.
This creates several connected effects:
- Existing homeowners list fewer properties.
- Buyers face limited inventory and elevated prices.
- First-time buyers carry higher monthly payments.
- Families postpone moving for work or personal reasons.
- Housing-related purchases such as furniture, appliances, and renovations are delayed.
- Larger housing payments leave less income for other consumption.
A simple way to think about mortgage lock-in is that homeowners are not only attached to their houses. They are attached to the financing terms.
Low supply can keep home prices firm even when mortgage affordability is poor. Meanwhile, renters and new buyers do not benefit from the low fixed rates secured by existing owners.
That makes housing affordability one of the clearest reasons why strong aggregate spending can coexist with weak household sentiment.
For investors, US consumer spending 2026 cannot be evaluated without considering housing affordability, mortgage rates, and household cash flow together.
The Fed’s Real Dilemma
The Federal Reserve cannot look only at how financially comfortable consumers feel. It must also consider whether overall demand is strong enough to keep inflation elevated.
If consumer spending remains resilient, companies may retain more pricing power. Service inflation can stay persistent, and the Fed may be reluctant to reduce interest rates quickly.
But keeping rates high creates a different set of risks.
Resilient spending does not necessarily mean financially healthy consumers.
High rates continue to pressure mortgage affordability, credit costs, business activity, and household cash flow. The full effect can also arrive slowly because many borrowers have fixed-rate debt and do not feel higher interest rates until they move, refinance, replace a vehicle, or carry a credit card balance.
The Fed therefore faces an uncomfortable trade-off:
- Strong demand can increase the risk of renewed inflation pressure.
- Prolonged high rates deepen housing and borrowing stress.
- Consumer weakness may appear later than investors expect.
- Current spending alone cannot confirm that the economy has achieved a durable soft landing.
The New York Fed reported that 4.8% of outstanding household debt was in some stage of delinquency in the first quarter of 2026. Credit card transitions into early delinquency edged down slightly, while mortgage transitions into serious delinquency increased modestly. The mixed picture supports the idea that consumer stress should be monitored rather than described with a single label.
Five Signals I Use to Judge Consumer Strength
No single indicator can show whether the U.S. consumer is truly strong.
Headline spending may remain positive while purchasing power, credit quality, and housing affordability weaken beneath the surface. When the data feel contradictory, I use the following framework.
| Indicator | What It Measures | Why I Check It Before Calling the Consumer “Strong” |
|---|---|---|
| Real PCE | Consumer spending adjusted for inflation | It shows whether Americans are buying more or simply paying more. |
| Core PCE Inflation | Underlying inflation excluding food and energy | Persistent core inflation may keep the Fed cautious about rate cuts. |
| Debt and Delinquencies | Stress in household credit payments | Rising delinquencies can suggest that spending is becoming harder to sustain. |
| Mortgage Rates and Housing Inventory | Affordability, supply, and mortgage lock-in | These reveal whether housing mobility and discretionary cash flow are improving. |
| Corporate Earnings Guidance | Real-time consumer behavior reported by companies | Management can identify weaker traffic, trading down, and promotion sensitivity before national data fully reflect them. |
The value of this framework comes from comparing the signals.
Rising real PCE, stable delinquencies, and improving corporate guidance would suggest relatively healthy demand. Rising nominal sales alongside weak real spending and worsening credit performance would tell a less comfortable story.
Investors can add three supporting indicators: inflation-adjusted retail sales, consumer confidence, and existing-home inventory. Confidence shows how households view jobs and future income, while inventory helps reveal whether the housing freeze is easing.
I pay particular attention to earnings calls from retailers, restaurants, airlines, hotels, and consumer brands. Government data tell us how much was spent. Management commentary often explains how it was spent.
Customers may be visiting less frequently, buying fewer items, waiting for promotions, or shifting toward lower-priced products. Revenue can remain stable for a time even while those behaviors signal weakening affordability.
A Practical Investing Perspective
Macroeconomic indicators tell us what to watch, but they cannot pinpoint the exact execution price. This is where I combine broad economic analysis with limited use of technical indicators.
My usual order is straightforward:
- Review company earnings and management guidance.
- Check whether the valuation already reflects optimistic expectations.
- Compare the company’s results with consumer, inflation, and interest-rate trends.
- Use technical indicators only as secondary timing tools.
Macro conditions can help investors decide what to watch, but they cannot identify an exact entry price.
While real PCE and mortgage rates help frame the longer-term environment, daily RSI or Bollinger Band behavior may help evaluate entry risk during periods of high macro volatility.
An oversold RSI reading does not prove that a decline has ended. A stock can remain oversold while earnings estimates fall or financial conditions deteriorate.
A Bollinger Band squeeze indicates that volatility has contracted. It does not predict the direction of the next move.
This matters with consumer stocks because an attractive chart can appear at the same time management is warning about weaker traffic, heavier promotions, or customers trading down. Technical analysis is most useful after the fundamental and macro questions have been considered.
Practical Investor Takeaway
The most useful lesson from US consumer spending 2026 is that spending and affordability measure different things.
Consumers have not stopped participating in the economy. They are prioritizing certain experiences while making more compromises in everyday life.
A practical routine is to ask three questions:
- Is spending growth still positive after adjusting for inflation?
- Is it being supported by income, or accompanied by rising credit stress?
- Are companies seeing healthy volume, or relying on higher prices and promotions?
Those questions make it easier to distinguish genuine consumer resilience from adaptation to a higher cost of living.
❓ FAQ
Q1. Is strong consumer spending always a sign of a healthy economy?
No. Spending can rise because prices are higher, even when consumers are not buying more. Real inflation-adjusted spending gives a clearer view of purchasing power.
Q2. Why do consumers keep traveling while cutting other expenses?
Households often protect purchases that feel memorable or difficult to postpone. They may fund travel by reducing restaurant visits, choosing cheaper brands, or delaying large purchases.
Q3. Can mortgage rates affect spending outside the housing market?
Yes. Higher housing payments leave less money for discretionary purchases. Low housing turnover can also reduce spending on furniture, appliances, renovations, and moving services.
Q4. How can investors tell whether spending is supported by debt?
Compare real spending and income growth with credit card balances and delinquency rates. Spending accompanied by rising payment stress may be less sustainable.
Q5. Could weaker affordability eventually lead to rate cuts?
It could contribute to slower demand, but the Fed also considers inflation and employment. Affordability pressure alone does not guarantee a specific policy decision.
Final Thoughts
The debate around US consumer spending 2026 cannot be reduced to a simple question of whether American consumers are strong or weak.
Americans continue to spend, but they are changing where that money goes. Travel and meaningful experiences may remain protected, while everyday purchases become more price-sensitive.
High spending totals do not automatically indicate stronger purchasing power. Housing costs, mortgage rates, and elevated prices continue to restrict household flexibility.
That is the Fed’s consumer dilemma. Resilient demand may keep inflation pressure alive, while restrictive interest rates gradually deepen affordability problems.
Investors should look past the headline and focus on real spending, household credit, housing conditions, and company guidance. Together, these signals offer a more complete picture than nominal sales alone.
A healthier consumer economy is not simply one that spends more. It is one in which spending growth is supported by improving purchasing power rather than higher prices.
Related Reading

Stock Valuation Checklist: 7 Critical Checks Before Calling a Stock Cheap
A stock can look cheap because its price has fallen 40%, its P/E ratio is…
RSI Divergence vs MACD Crossover: Which Is More Reliable for Trading?
RSI divergence can warn that price momentum is weakening before a reversal becomes obvious. A…
Before You Buy the Dip: 5 Critical Balance Sheet Checks Every Investor Should Make
A stock that falls 20%, 30%, or even 50% can suddenly look cheap. But a…
Disclaimer: This article is for educational purposes only. It is not financial advice or a recommendation to buy or sell any specific stock, ETF, cryptocurrency, or other asset. All investment decisions are your own responsibility.