
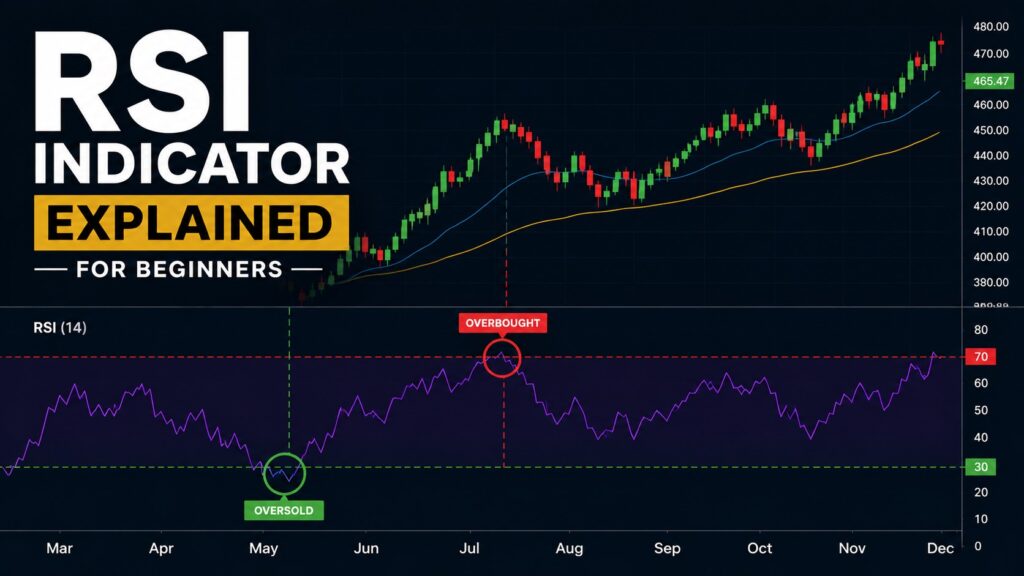
If you’re new to technical analysis, you’ve probably come across the Relative Strength Index (RSI). At first, it looks simple: RSI above 70 means overbought, and RSI below 30 means oversold.
But in real markets, this simple rule often leads beginners to the wrong conclusion. The RSI is a momentum indicator. It helps you understand whether recent buying or selling pressure is strong, but it does not tell you exactly where price will go next.
That is the most important point beginners should remember. RSI is not a prediction tool. It is a tool for reading momentum.
RSI Indicator Explained for Beginners: What Is RSI?
The Relative Strength Index (RSI) measures the strength of recent price movement on a scale from 0 to 100. The most common setting is 14 periods.
A simple way to understand RSI is this: when RSI rises, buyers have recently been stronger. When RSI falls, sellers have recently been stronger. So instead of asking, “Should I buy or sell because of RSI?” it is better to ask, “Is momentum getting stronger or weaker?”
What Does RSI Above 70 or Below 30 Mean?
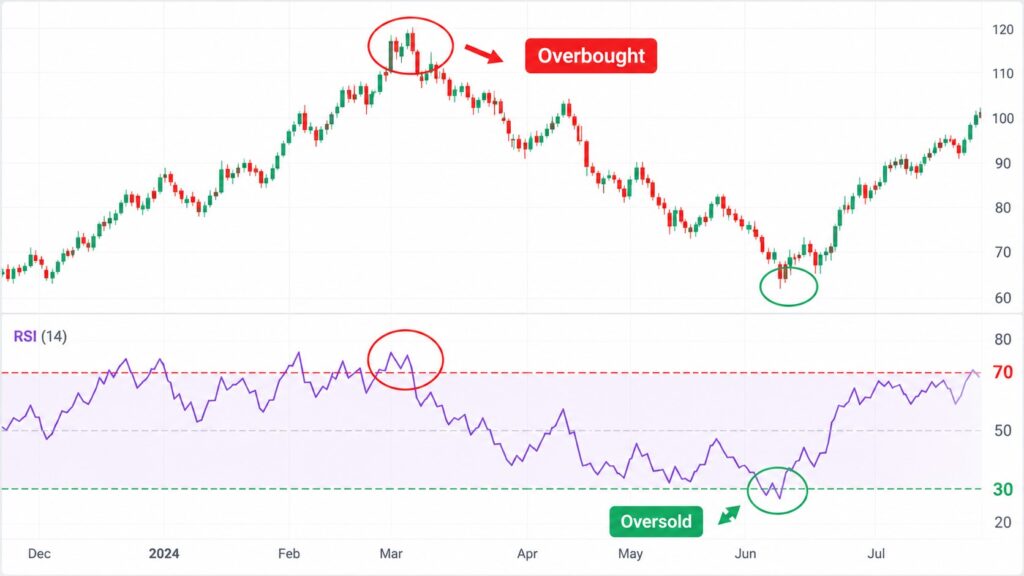
The most common RSI levels are 70 and 30.
| RSI Level | Common Meaning |
|---|---|
| Above 70 | Strong buying momentum |
| Below 30 | Strong selling momentum |
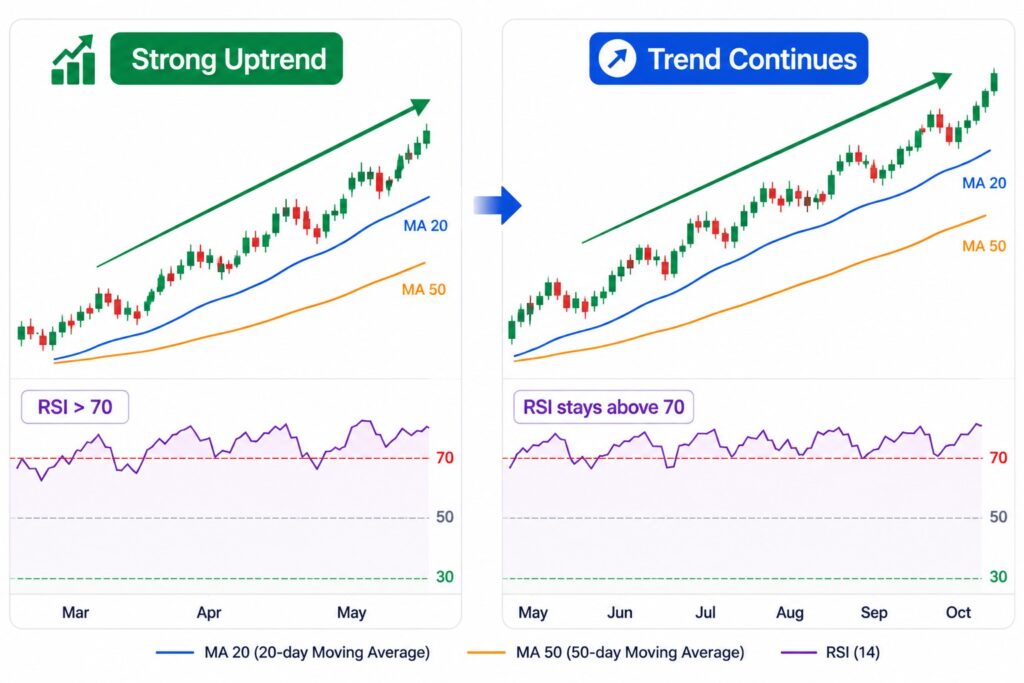
Many beginners think RSI above 70 means the price must fall soon. But that is not always true. In a strong uptrend, RSI can stay above 70 for a long time. This often means buyers are still in control.
The same applies to RSI below 30. In a strong downtrend, RSI can remain low while price continues falling. That is why RSI should never be used alone.
Why Trend Matters More Than the RSI Number
One mistake I made early was looking at the RSI number before checking the chart trend. Now I always look at the bigger picture first. I check whether the market is making higher highs and higher lows, or lower highs and lower lows.
If the trend is strong, an overbought RSI may simply confirm strong momentum. If the trend is weak, an oversold RSI may not be enough reason to buy. The trend gives meaning to RSI, not the other way around.
A Simple RSI Example
Imagine the SPY ETF has been rising for several weeks and staying above its 20-day and 50-day moving averages. Then RSI moves above 70. A beginner may think, “It is overbought, so I should sell.”
But if price is still making higher highs and volume is not showing weakness, RSI may simply be confirming that the trend is strong. Now imagine a different situation. SPY reaches a major resistance level, RSI is above 70, volume starts to fade, and price struggles to make new highs.
That is a stronger warning sign because RSI is now combined with resistance, weak volume, and slowing price action. This is why RSI works best when used with price action, support and resistance, and volume.
RSI Range Shift: Why 70 and 30 Are Not Always Enough
RSI behaves differently depending on the market condition.
| Market Condition | Common RSI Range |
| Strong uptrend | 40–80 |
| Sideways market | 30–70 |
| Strong downtrend | 20–60 |
In a strong uptrend, RSI may not fall to 30 before price rebounds. It may find support near 40. In a strong downtrend, RSI may fail near 60 instead of reaching 70.
This is called a range shift. It helps beginners understand that RSI levels are not fixed rules. They change depending on the trend.
Be Careful with RSI Divergence
RSI divergence happens when price and RSI move in different directions. For example, price may make a higher high while RSI makes a lower high. This can mean momentum is weakening.
However, divergence is not an automatic sell signal. In strong trends, divergence can appear several times before price actually reverses. I treat divergence as a warning sign, not a final decision. I still wait for price confirmation, volume change, or a break of support or resistance.
My Simple RSI Checklist
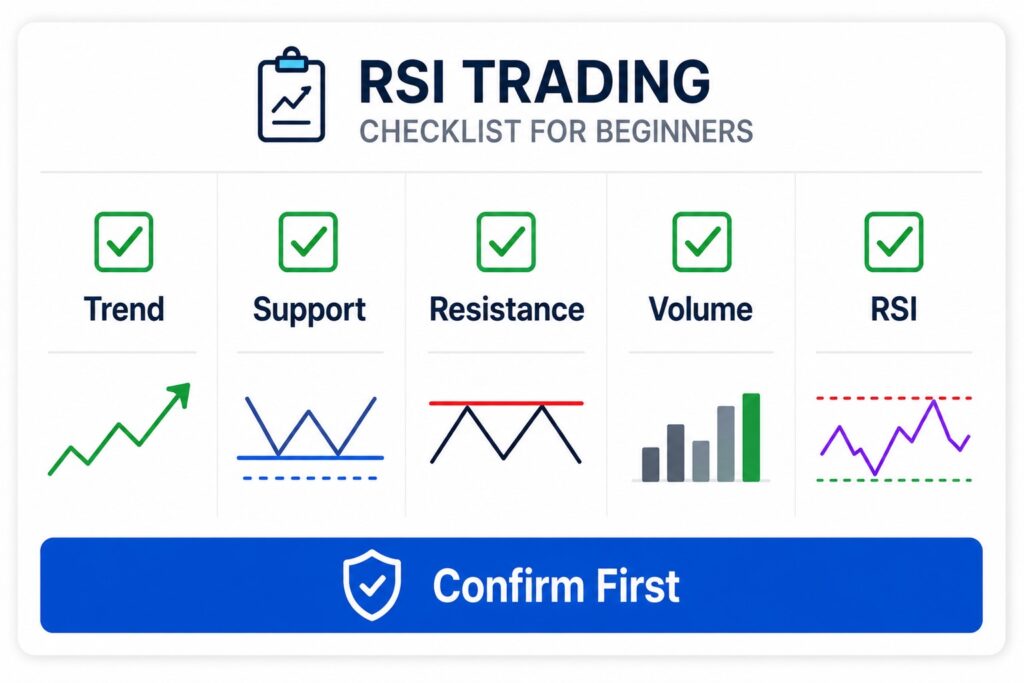
Before using RSI, I ask myself a few questions.
- What is the overall trend?
- Is price near support or resistance?
- Is volume confirming the move?
- Is RSI showing real momentum or only reacting to one large candle?
- Would the chart still look strong or weak if I removed the RSI?
That last question is especially useful. If the chart already looks strong without RSI, the indicator is only confirming the trend. If the chart looks weak without RSI, one oversold reading is not enough reason to buy.
Common RSI Mistakes Beginners Make
Many beginners lose money with RSI because they use it too mechanically. They buy every time RSI falls below 30, sell every time RSI rises above 70, or trust divergence without confirmation.
Other common mistakes include ignoring the overall trend, using RSI without volume, and looking only at short-term charts. RSI is useful, but it should be part of a process, not the entire strategy.
Can RSI Be Used for Stocks, ETFs, and Bitcoin?
RSI works across almost every liquid financial market, including stocks, ETFs, cryptocurrencies, commodities, and foreign exchange.
Highly volatile assets such as Bitcoin can remain in overbought or oversold territory much longer than many beginners expect, especially during strong trends.
For instance, on short-term Bitcoin charts such as the 5-minute or 15-minute timeframe, a powerful momentum push can keep RSI elevated for several consecutive waves. Traders who focus only on the short-term RSI reading often assume a reversal is imminent, only to watch the trend continue.
That does not make RSI less useful.
It simply reminds us that momentum should always be interpreted within the context of the broader trend, the selected timeframe, and the behavior of the asset being analyzed.
Final Takeaway
As this RSI Indicator Explained for Beginners guide shows, RSI is one of the easiest indicators to understand, but it is also easy to misuse. The key is simple: do not treat RSI as a buy or sell button. Use it to read momentum.
First, check the trend. Then look at support and resistance. After that, review volume. Finally, use RSI to confirm whether momentum supports what price is already showing.
If you build that habit, RSI becomes much more useful and much less confusing.
❓ FAQ
Q1. Is RSI a good indicator for beginners?
Yes. As this RSI Indicator Explained for Beginners article shows, RSI is one of the easiest technical indicators to understand because it measures momentum on a simple scale from 0 to 100.
Q2. Does RSI above 70 always mean I should sell?
No. An RSI reading above 70 simply shows that buying momentum has been strong. During powerful uptrends, RSI can remain above 70 for an extended period while prices continue moving higher.
Q3. Is RSI below 30 always a buying opportunity?
Not necessarily. An RSI below 30 indicates strong selling momentum, but prices can continue falling in a downtrend. Waiting for confirmation from price action or a support level is usually a safer approach.
Q4. What is the best RSI setting?
The default 14-period RSI is the most widely used setting and is a good starting point for most beginners. More experienced traders sometimes adjust the setting depending on their trading style or timeframe.
Q5. Can I use RSI for Bitcoin and other cryptocurrencies?
Yes. RSI works well on Bitcoin and other cryptocurrencies, but crypto markets are often more volatile than stocks. During strong trends, RSI can remain overbought or oversold for much longer than many beginners expect, especially on short-term charts.
📚 Related Articles
MACD Indicator Explained: A Smart Beginner’s Guide to Better Chart Reading
How to Read Bollinger Bands: 5 Beginner Mistakes to Avoid
Trading Volume for Beginners: How to Read It With Price Action
Moving Averages in Stocks: The Ultimate Guide to Clear Trend Reading

Stock Valuation Checklist: 7 Critical Checks Before Calling a Stock Cheap
A stock can look cheap because its price has fallen 40%, its P/E ratio is…
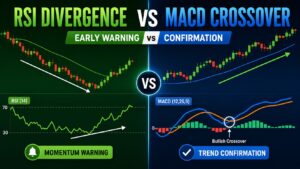
RSI Divergence vs MACD Crossover: Which Is More Reliable for Trading?
RSI divergence can warn that price momentum is weakening before a reversal becomes obvious. A…

Before You Buy the Dip: 5 Critical Balance Sheet Checks Every Investor Should Make
A stock that falls 20%, 30%, or even 50% can suddenly look cheap. But a…
Disclaimer: This article is for educational purposes only. It is not financial advice or a recommendation to buy or sell any specific stock, ETF, cryptocurrency, or other asset. All investment decisions are your own responsibility.
Pingback: MACD Indicator Explained: A Smart Beginner’s Guide to Better Chart Reading
Pingback: How to Read Bollinger Bands: 5 Beginner Mistakes to Avoid