
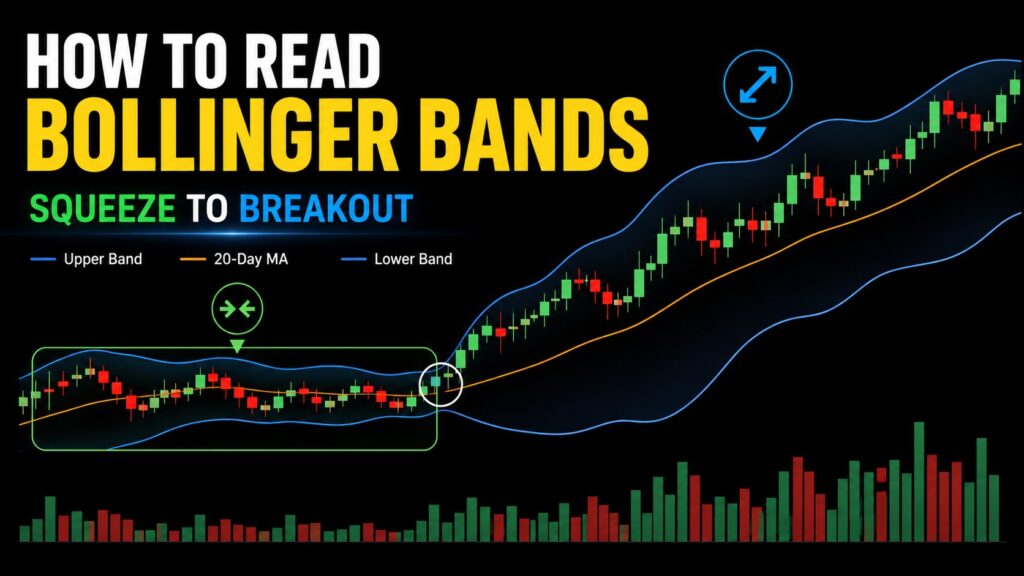
If you are learning stock charts, Bollinger Bands can look simple at first. You see three lines around price, and it feels natural to think, “If price touches the upper band, it must be expensive,” or “If price touches the lower band, it must be cheap.”
That is one of the most common beginner mistakes.
Most beginners use Bollinger Bands to predict reversals. Ironically, the indicator often works best when it helps you avoid making predictions in the first place.
Learning how to read Bollinger Bands is not about memorizing a buy or sell signal. It is about understanding volatility, trend strength, and market context.
That is why learning how to read Bollinger Bands correctly matters before using them in real chart analysis.
Used properly, Bollinger Bands can help you see when a stock is quiet, when volatility is expanding, and when price may be stretched compared with recent movement. But they should never be used alone.
What Are Bollinger Bands and How Do They Work?
Bollinger Bands are a technical analysis indicator developed by John Bollinger in the 1980s.
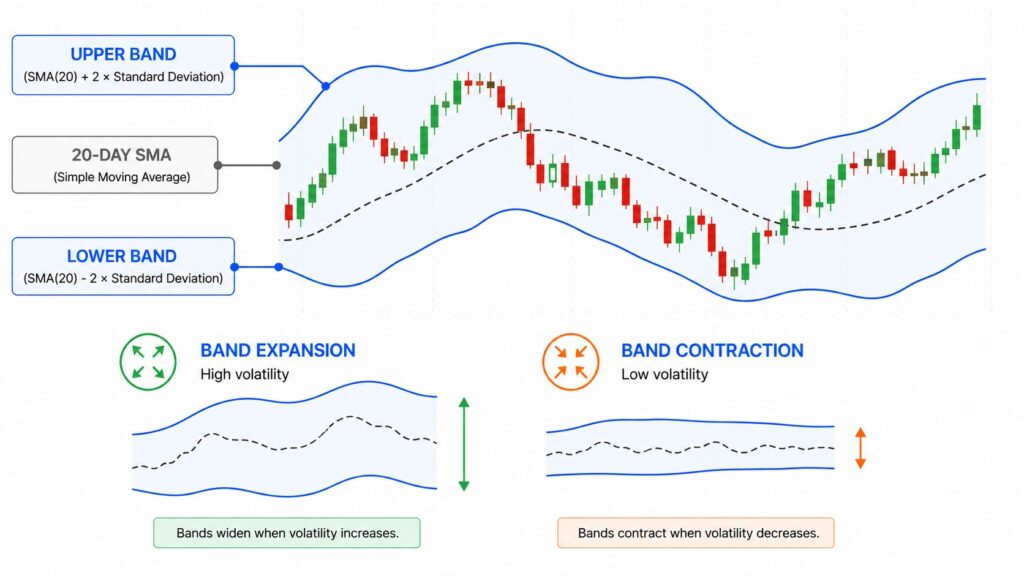
The indicator has three parts:
• Middle Band: usually a 20-period Simple Moving Average (SMA)
• Upper Band: the middle band plus two standard deviations
• Lower Band: the middle band minus two standard deviations
A simple version of the formula looks like this:
Upper Band = SMA(20) + (2 × Standard Deviation)
Lower Band = SMA(20) − (2 × Standard Deviation)
This basic structure is the starting point for learning how to read Bollinger Bands in a practical way.
> Under normal statistical assumptions, about 95% of the price action stays within these bands.
This is why Bollinger Bands expand and contract.
When price movement becomes more volatile, standard deviation rises, and the bands widen. When price movement becomes quieter, standard deviation falls, and the bands narrow.
However, markets are not perfect statistical models. A stock can remain outside or near a Bollinger Band much longer than beginners expect, especially during strong uptrends or downtrends. That is why Bollinger Bands should always be interpreted alongside trend, volume, and overall market context rather than as automatic buy or sell signals.
For readers who want to explore the indicator in more depth, John Bollinger’s official website provides additional educational resources.
Why Bollinger Bands Matter for Investors
Bollinger Bands are useful because they show two things at the same time:
• where price is compared with its recent average
• how much volatility is expanding or contracting
Many beginners focus only on direction. They ask, “Is the stock going up or down?”
A better question is: “Is the market becoming more volatile, or is it getting quiet before the next move?”
For example, a stock like NVDA or TSLA can move sharply during strong momentum phases. In those situations, the upper band does not always mean “too expensive.” Sometimes it means buyers are still aggressive.
Reviewing historical charts of these stocks can help you understand how Bollinger Bands behave during strong trends.
This is where context matters.
How to Read Bollinger Bands Step by Step
When I review a chart, I try not to start with the indicator first. I start with the market structure.
Earlier in my investing journey, I often focused on Bollinger Bands before looking at the overall trend. That usually led me to misread strong momentum as an immediate reversal.
Bollinger Bands are helpful only after you understand the trend.
1. Start With the Bigger Trend
Look at the daily or weekly chart first.
Ask:
- Is the stock making higher highs and higher lows?
- Is it moving sideways?
- Is it in a clear downtrend?
- Is the broader market, such as SPY or QQQ, supporting the move?
This step helps you avoid reacting emotionally to one candle.
A lower band touch in a strong downtrend is very different from a lower band touch near long-term support during a healthy uptrend.
2. Watch the Width of the Bands: The Squeeze
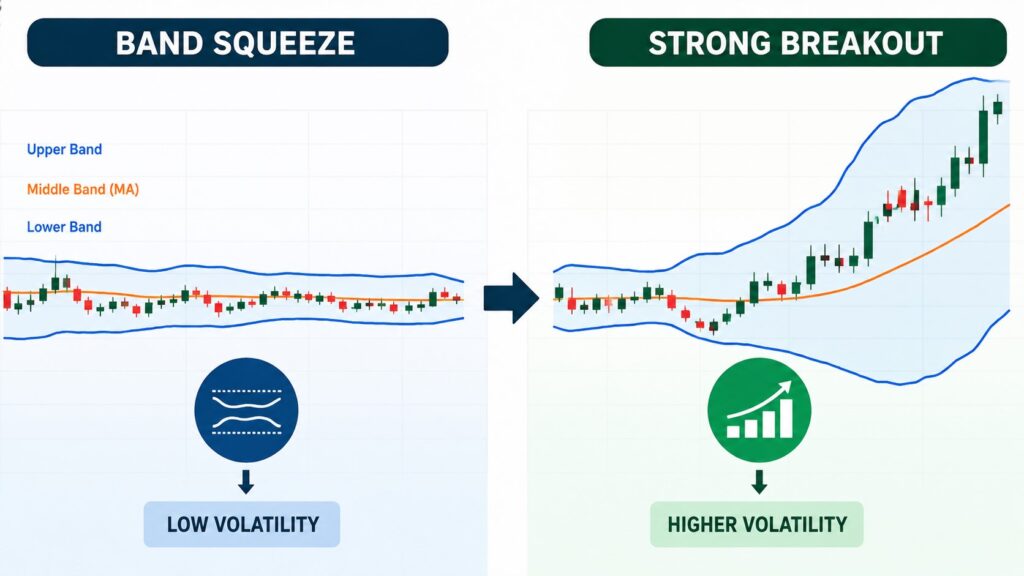
When the bands become very narrow, traders call it a Bollinger Band Squeeze.
Think of it like a spring being compressed.
A squeeze means volatility has become unusually low. It often happens before a larger move, but it does not tell you the direction.
That part is important because many beginners see a squeeze and immediately guess a breakout direction. In my own chart routine, I prefer to wait for a strong daily candle to close outside the band, ideally with rising volume, before taking the breakout seriously.
A squeeze is not a prediction. It simply warns that the market may be preparing for a larger move.
3. Understand Band Walking in Strong Trends
One of the most important Bollinger Band lessons is Band Walking.
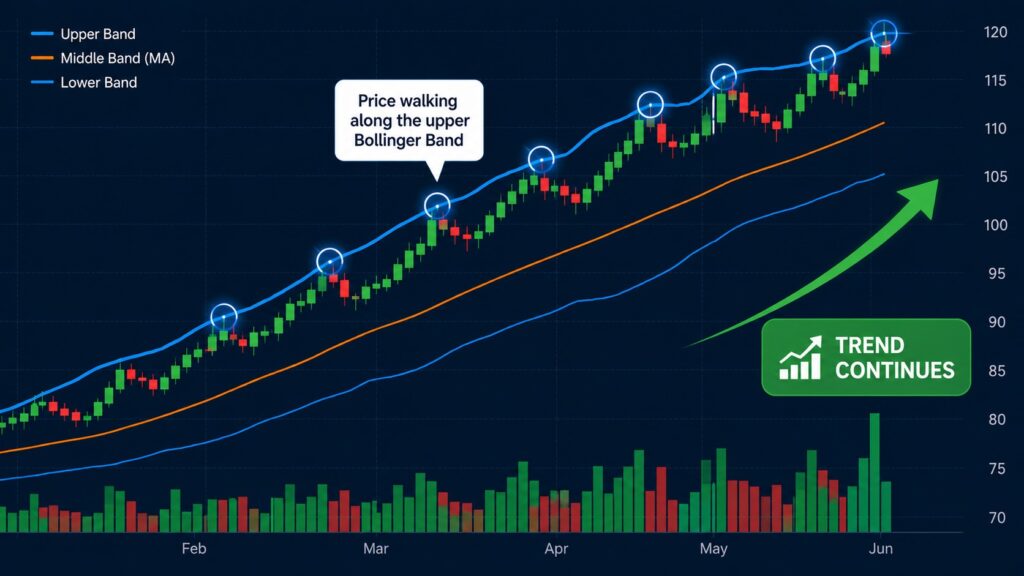
Band Walking happens when price keeps moving along the upper band during a strong uptrend, or along the lower band during a strong downtrend.
This is where many beginners get trapped.
During strong rallies, especially in momentum stocks like NVDA, many new traders assume that touching the upper band means the stock must fall soon. But in a powerful trend, price can continue riding the upper band while the bands keep widening.
I saw this mistake often during the 2024–2025 AI-related stock rally. Some charts looked “too high” if I only focused on the upper band. But when I checked the 20-day SMA, earnings momentum, and broader market sentiment, the trend was still stronger than it first appeared.
That experience taught me not to fight a strong trend just because price touched the upper band.
A more practical approach is to watch the middle band.
In a strong uptrend, the 20-day SMA often acts like a short-term trend guide. If price keeps respecting the middle band, the trend may still be intact. If price breaks below it with weak volume behavior or broader market pressure, then the signal becomes more meaningful.
The key is not “upper band equals sell.” The real question is whether trend strength is continuing or fading.
4. Do Not Treat Band Touches as Automatic Signals
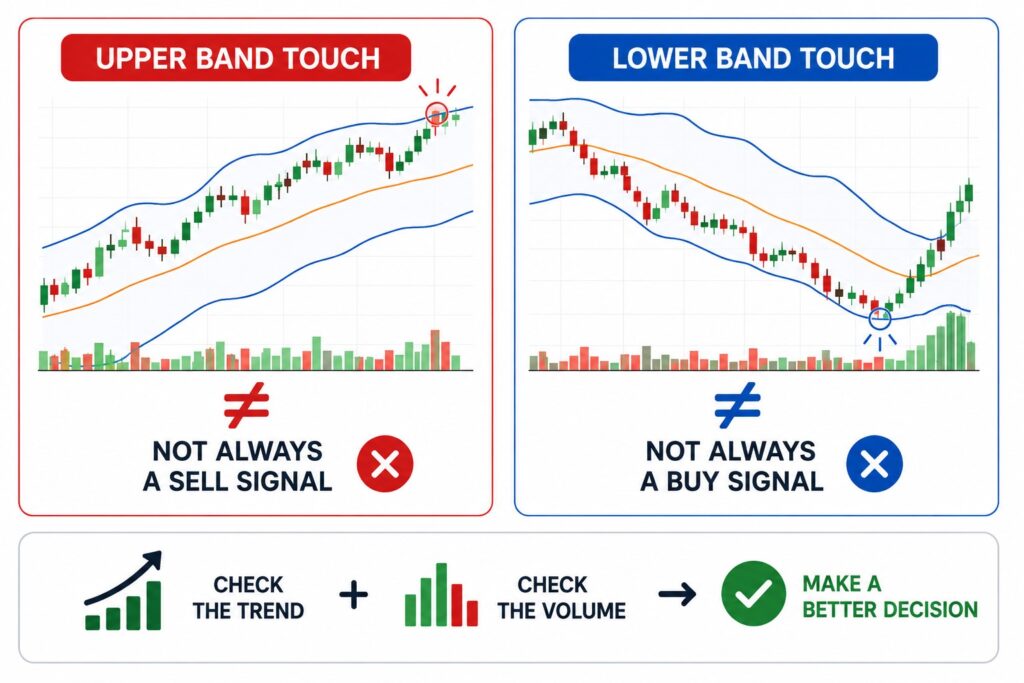
A price touching the upper band does not automatically mean overbought.
A price touching the lower band does not automatically mean oversold.
This is probably the most dangerous misunderstanding for beginners.
Here is a better way to read band touches:
| Situation | Better Interpretation |
|---|---|
| Upper band touch in strong uptrend | Possible momentum strength |
| Upper band touch near resistance with weak volume | Possible exhaustion |
| Lower band touch in strong downtrend | Possible continued weakness |
| Lower band touch near support with strong rebound candle | Possible reaction area |
The same indicator can mean different things depending on trend, volume, and support or resistance.
That is why Bollinger Bands should be treated as a context tool, not a trading signal machine.
Bollinger Bands and Volume: A Simple Confirmation Tool
Volume helps you judge whether a Bollinger Band signal has real participation behind it.
For example, if price breaks above the upper band after a long squeeze and volume increases sharply, that breakout may deserve attention. But if price moves above the band on weak volume, the move may be less reliable.
The same idea applies to downside moves.
A break below the lower band with heavy selling volume can show strong downside pressure. A quick dip below the band followed by a strong rebound candle may suggest sellers failed to maintain control.
I usually ask one simple question.
Did price move outside the band because real demand or supply appeared, or was it just a temporary emotional move?
That question alone can prevent many rushed decisions.
A Practical Bollinger Band Routine for Beginners
Here is a simple routine you can use when reading a stock chart:
- Start with the daily or weekly chart.
- Identify the larger trend.
- Mark nearby support and resistance.
- Check whether the bands are expanding or contracting.
- Look for squeeze, breakout, or band walking behavior.
- Compare the move with volume.
- Check broader market conditions using SPY, QQQ, or major indexes.
- Avoid making decisions from Bollinger Bands alone.
This routine is not designed to predict the market perfectly.
It is designed to slow you down and help you read the chart more clearly.
Bollinger Bands Checklist
Before using Bollinger Bands for analysis, check these points:
- Is the larger trend up, down, or sideways?
- Are the bands expanding or contracting?
- Is price walking the band or reversing from it?
- Is volume confirming the move?
- Is price near support or resistance?
- Is the broader market supporting the direction?
- Am I using Bollinger Bands with other tools?
This checklist can help beginners avoid one of the biggest mistakes: making a decision from the band touch alone.
Common Beginner Mistakes
Bollinger Bands are easy to add to a chart, but easy to misuse.
The biggest mistakes are:
- Buying every lower band touch.
- Selling every upper band touch.
- Ignoring the 20-day middle band.
- Forgetting that strong trends can ride the band.
- Treating a squeeze as a guaranteed breakout direction.
- Using Bollinger Bands without volume or support and resistance.
One mistake I made early was thinking the indicator itself was the answer. Over time, I realized the indicator is only useful when it helps me ask better questions about volatility, trend, and market behavior.
Practical Investor Takeaway
Bollinger Bands are not magic lines. They are a visual way to understand moving averages, volatility, and price extension.
The middle band shows the recent average trend, while the upper and lower bands show how far price is moving compared with recent volatility.
For beginners, the most useful lesson is simple.
Do not ask, “Did price touch the band?”
Ask, “What does this band behavior say about trend strength, volatility, and market context?”
That small shift can make Bollinger Bands much more useful.
If you would like to explore the indicator in more depth, Investopedia offers a beginner-friendly explanation of the calculation, terminology, and practical applications.
Final Thoughts
Most beginners lose money with Bollinger Bands because they expect the indicator to predict the market. In reality, Bollinger Bands are far more useful for understanding volatility than forecasting direction.
A squeeze can warn you that volatility may return. Band Walking can show trend strength. A lower band touch can highlight possible weakness or a reaction area, depending on the trend.
The indicator becomes most useful when it is used with support and resistance, volume, moving averages, and broader market context.
For beginner investors, that is the real goal.
Not perfect prediction.
Better interpretation.
❓ FAQ
Q1. Are Bollinger Bands good for beginners?
Yes. Bollinger Bands are beginner-friendly because they visually show trend and volatility. But they should not be used as standalone buy or sell signals.
Q2. What is the best Bollinger Band setting?
The common default setting is a 20-period SMA with bands placed two standard deviations above and below it. Beginners can start there before experimenting.
Q3. What does a Bollinger Band Squeeze mean?
A squeeze means volatility has become unusually low. It can happen before a larger move, but it does not predict the direction by itself.
Q4. What is Bollinger Band Walking?
Band Walking happens when price moves along the upper band in a strong uptrend or along the lower band in a strong downtrend. It often shows trend strength, not immediate reversal.
Q5. Should I buy when price touches the lower Bollinger Band?
Not automatically. Check the larger trend, support level, volume, and candle reaction before interpreting the signal.
📚 Related Articles
Moving Averages in Stocks: The Ultimate Guide to Clear Trend Reading
RSI Indicator Explained for Beginners: How to Read Momentum Without Overreacting
MACD Indicator Explained: A Smart Beginner’s Guide to Better Chart Reading
Trading Volume for Beginners: How to Read It With Price Action

Stock Valuation Checklist: 7 Critical Checks Before Calling a Stock Cheap
A stock can look cheap because its price has fallen 40%, its P/E ratio is…
RSI Divergence vs MACD Crossover: Which Is More Reliable for Trading?
RSI divergence can warn that price momentum is weakening before a reversal becomes obvious. A…
Before You Buy the Dip: 5 Critical Balance Sheet Checks Every Investor Should Make
A stock that falls 20%, 30%, or even 50% can suddenly look cheap. But a…
Disclaimer: This article is for educational purposes only. It is not financial advice or a recommendation to buy or sell any specific stock, ETF, cryptocurrency, or other asset. All investment decisions are your own responsibility.
Pingback: MACD Indicator Explained: A Smart Beginner’s Guide to Better Chart Reading