
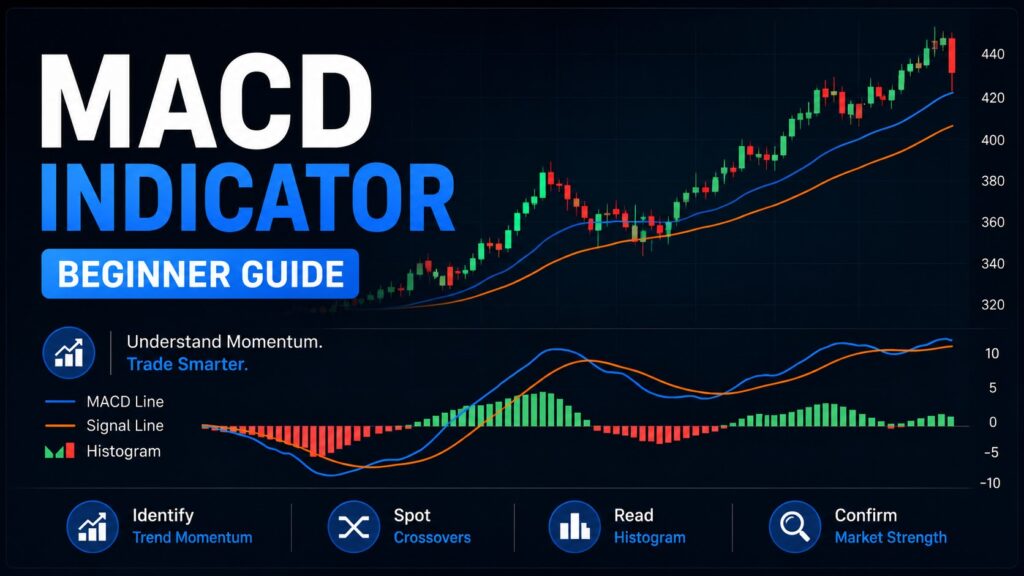
The MACD indicator is one of the most widely used tools in technical analysis. It is popular because it looks simple, but that simplicity can also be dangerous for beginners. Many new investors learn that a bullish MACD crossover means “buy” and a bearish crossover means “sell.” That explanation is easy to remember, but it is not enough for real chart reading.
When I first learned MACD, I made that same mistake. I paid too much attention to the crossover itself and ignored the bigger picture. After seeing several signals fail, I realized that a MACD crossover by itself does not tell the whole story.
The same bullish crossover can mean very different things depending on where it happens, what the price trend looks like, whether the stock is near support or resistance, and whether volume supports the move. This guide explains the MACD indicator in a practical way, especially for beginner investors who want to avoid reacting to every signal on the chart.
What Is the MACD Indicator?
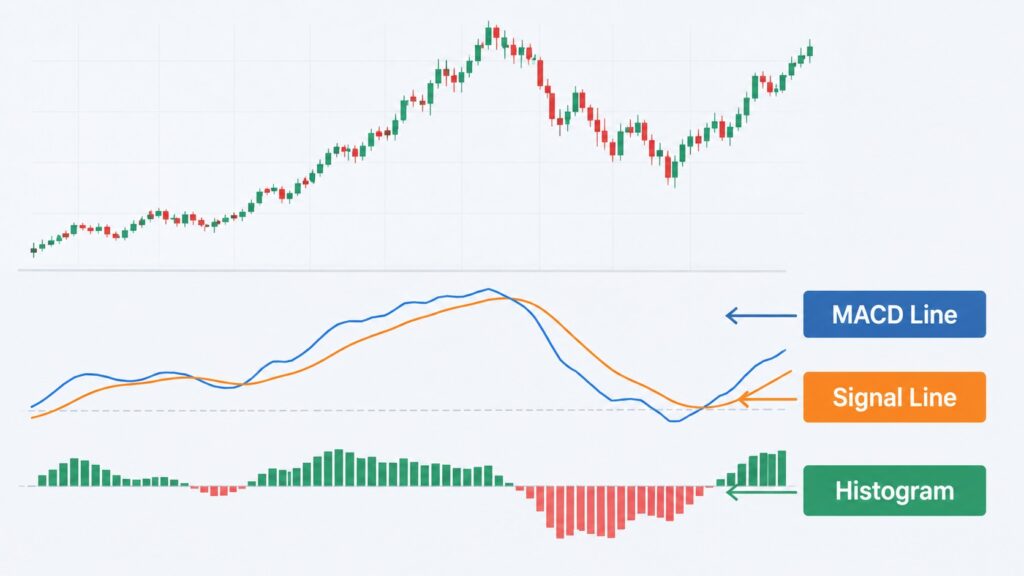
MACD stands for Moving Average Convergence Divergence. It is a momentum indicator that helps investors understand whether price momentum is getting stronger or weaker.
Most charting platforms show MACD with three main parts: the MACD Line, the Signal Line, and the Histogram. The MACD Line reacts to changes in price momentum, while the Signal Line smooths that movement. The Histogram shows the distance between the two lines.
A simple way to understand MACD is this: price tells you where the stock is now, while MACD helps you see whether the force behind that price movement is increasing or fading.
This matters because price and momentum do not always move at the same speed. A stock can still be rising while momentum is weakening. A stock can also keep falling even while selling pressure is starting to slow down. MACD is useful because it helps you notice those changes more clearly.
For a more detailed definition of the MACD formula, you can also refer to Investopedia’s MACD indicator guide.
The Default MACD Setting: 12, 26, 9
The most common MACD setting is 12, 26, 9. This is the default setting on many charting platforms. In simple terms, MACD compares a shorter-term moving average with a longer-term moving average, then uses a 9-period signal line to smooth the movement.
For beginners, I do not recommend changing the MACD setting too early. One common mistake is trying to adjust the indicator until it fits every chart perfectly. The problem is that if you keep changing the setting, the signals also change. That can make chart reading more confusing.
In my own routine, I prefer to start with the default MACD setting and focus on context first. Before I care about the crossover, I ask whether the stock is in an uptrend, downtrend, or sideways range. I also check whether price is above or below key moving averages, whether the signal is happening near support or resistance, and whether volume is increasing or fading.
The setting matters, but context matters more.
Why the Zero Line Matters
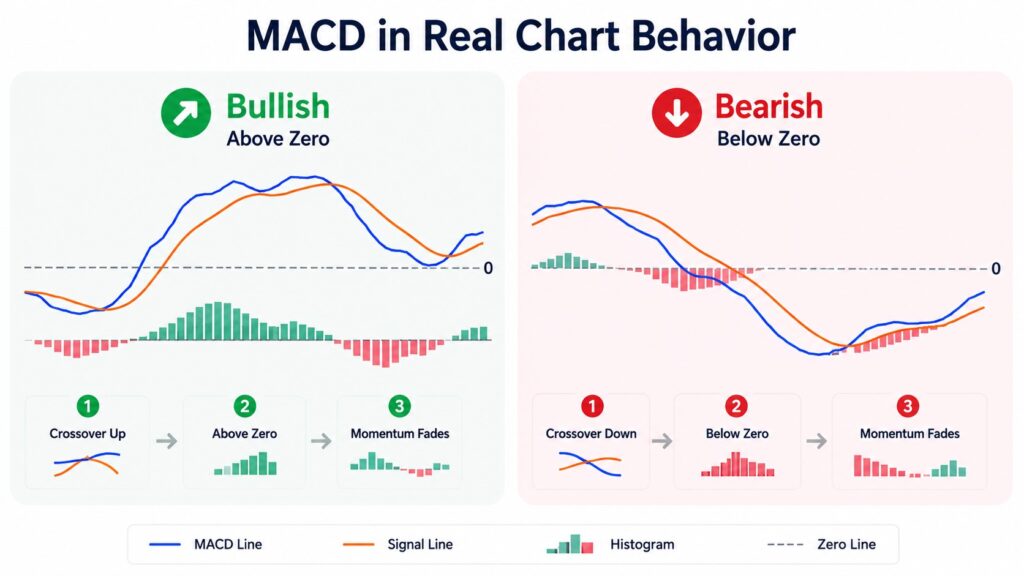
One of the most important parts of MACD is the zero line. Many beginners focus only on the MACD Line and Signal Line. They wait for the two lines to cross and react immediately. However, the zero line gives important context.
When MACD is above the zero line, momentum is generally stronger. When MACD is below the zero line, momentum is generally weaker. This does not mean every signal above zero will work, and it does not mean every signal below zero will fail. But it helps you understand the quality of the signal.
For example, a bullish MACD crossover below the zero line may only be a short-term bounce inside a larger downtrend. A bullish MACD crossover above the zero line can be more meaningful because momentum is already in a stronger zone.
The same idea applies to bearish signals. A bearish MACD crossover above the zero line may simply mean the stock is cooling off during an uptrend. A bearish MACD crossover below the zero line can be more serious because downside momentum is already stronger.
This was one of the biggest lessons I learned after using MACD for a while. At first, I treated all bullish crossovers the same. Later, I realized that a bullish crossover below the zero line and a bullish crossover above the zero line are not equal signals. The location of the signal matters.
How to Read a Bullish MACD Crossover
A bullish MACD crossover happens when the MACD Line crosses above the Signal Line. This can suggest that upward momentum is improving. However, beginners should not treat this as an automatic buy signal.
Before taking a bullish crossover seriously, I usually check the price trend first. If the stock is still making lower highs and lower lows, the bullish crossover may only be a temporary bounce. In that case, the signal may look positive on the indicator, but the actual price structure is still weak.
Next, I check whether price is near a support area. A bullish crossover near support can be more useful than a random crossover in the middle of a range. I also look at the histogram. If the negative histogram bars are shrinking, it may mean selling pressure is fading.
Finally, I check volume. If volume improves when price starts to recover, the signal becomes more interesting. A bullish MACD crossover is more useful when it agrees with price structure. It is weaker when it appears alone.
How to Read a Bearish MACD Crossover
A bearish MACD crossover happens when the MACD Line crosses below the Signal Line. This can suggest that momentum is weakening. But just like bullish crossovers, bearish crossovers also need context.
A bearish crossover above the zero line during a strong uptrend does not always mean the trend is over. Sometimes it only means the stock is taking a normal pause after a strong move. On the other hand, a bearish crossover below the zero line deserves more caution because price momentum is already weak.
When I see a bearish MACD crossover, I do not immediately assume the stock will collapse. Instead, I check whether price is near resistance, whether the stock is losing support, whether volume is increasing on down days, and whether the broader market is weakening.
If several of these conditions appear together, the bearish signal becomes more important. If the MACD signal is bearish but price is still holding above support and the broader trend remains strong, I try not to overreact.
MACD Histogram: A Simple Way to Read Momentum
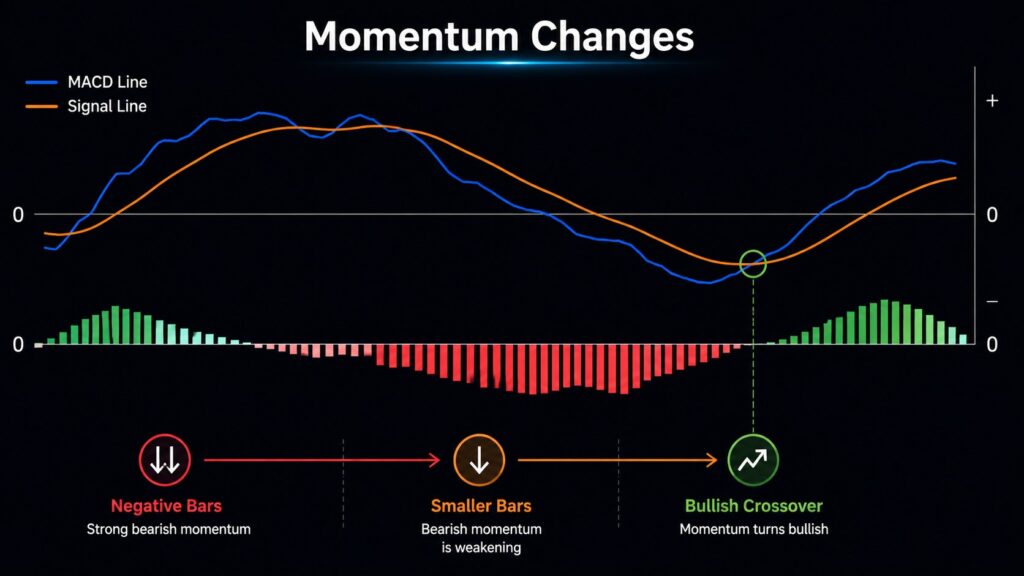
The MACD histogram is often easier for beginners to read than the two lines. The histogram shows the distance between the MACD Line and the Signal Line.
When the histogram bars are getting taller above zero, upward momentum is expanding. When the histogram bars are getting shorter above zero, upward momentum may be slowing. When the histogram bars are getting deeper below zero, downside momentum is expanding. When the negative bars start shrinking, selling pressure may be weakening.
This is useful because the histogram can sometimes show a momentum change before the crossover becomes obvious. For example, if a stock is falling but the negative histogram bars are getting smaller, it may mean sellers are losing strength. That does not mean the stock must rebound immediately, but it tells you that momentum is changing.
For beginners, this is a helpful habit: do not only look at whether the MACD lines crossed. Also look at whether the histogram is expanding or shrinking.
A Practical Example Using SPY
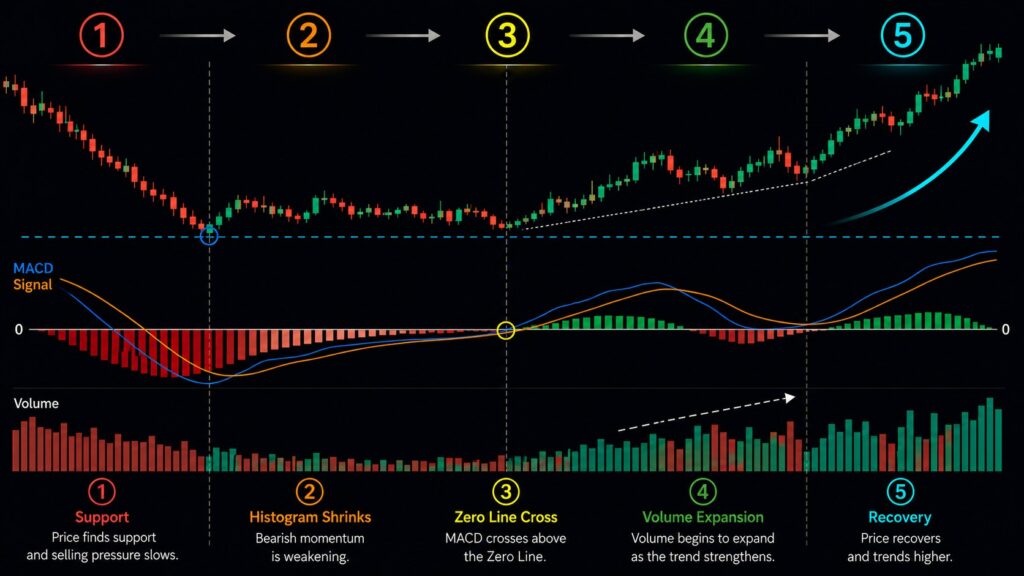
Let’s imagine SPY after a market pullback. Price has been falling for several days, the chart looks weak, and many beginners may feel afraid to look at it. At first, the MACD histogram is deeply negative. This tells us that downside momentum is strong.
But then something changes. SPY stops falling as quickly. Price begins to react near a support area. The negative histogram bars are still below zero, but they become shorter one by one. This suggests that selling pressure may be fading.
Then SPY forms a stronger candle near support. Volume improves slightly. After that, the MACD Line crosses above the Signal Line. The crossover alone is not the reason to be interested. The signal becomes more useful because several pieces of evidence are lining up.
Price is reacting near support, the histogram shows that selling pressure is fading, volume is improving, and MACD is confirming a possible momentum shift. This is very different from buying only because the MACD Line crossed above the Signal Line.
The goal is not to predict the exact bottom. The goal is to avoid making decisions from one isolated signal.
You can practice this kind of chart review using free interactive charts on TradingView.
MACD vs RSI: What Is the Difference?
MACD and RSI are both popular indicators, but they do not show the same thing. MACD focuses more on momentum changes and trend shifts, while RSI focuses more on whether price may be overbought or oversold.
For example, RSI can show that a stock is stretched after a strong move. MACD can help you see whether momentum is still building or starting to weaken. Moving averages show the broader trend, while volume shows whether buyers or sellers are actively participating.
This is why I do not like using MACD alone. A simple beginner-friendly combination is to use moving averages for trend direction, support and resistance for key price areas, MACD for momentum changes, and volume for confirmation.
You do not need ten indicators on one chart. It is better to understand a few tools clearly than to fill the screen with signals you cannot interpret.
Common Beginner Mistakes When Using MACD
The biggest mistake is treating every MACD crossover as a trading signal. A bullish crossover during a strong downtrend can fail quickly. A bearish crossover during a strong uptrend may only lead to a small pullback.
Another mistake is ignoring the zero line. A crossover above zero and a crossover below zero do not have the same meaning. Beginners also often use MACD on very short timeframes and get overwhelmed by false signals. Short-term charts can move quickly, and MACD can produce many signals that do not matter much.
Daily and weekly charts are usually easier for beginners because they reduce some of the noise. This does not mean short-term charts are useless, but beginners usually need to understand the larger trend first.
Another mistake is forgetting that MACD is a lagging indicator. MACD reacts to price movement. It does not magically predict the future. That does not make MACD useless. It simply means you should use it as a confirmation tool, not as a prediction machine.
My Simple MACD Routine
When I use MACD, I try to follow the same order each time. First, I start with the daily or weekly chart. I want to know whether the stock is in an uptrend, downtrend, or sideways range.
Second, I check key moving averages. If price is below important moving averages, I become more careful with bullish MACD signals. Third, I mark support and resistance. A MACD signal near an important price level is usually more useful than a random signal in the middle of the chart.
Fourth, I check the zero line. I want to know whether the crossover is happening above zero or below zero. Fifth, I look at the histogram to see whether momentum is expanding or fading.
Sixth, I confirm with volume. If price moves in one direction but volume does not support it, I become more cautious. Finally, I compare the stock with the broader market, such as SPY or QQQ. A bullish MACD signal is usually more reliable when the broader market is also stable or improving.
This routine helps me avoid reacting emotionally to one crossover. The better question is not, “Did MACD flash a signal?” The better question is, “Does this MACD signal agree with the price chart?”
Practical Investor Takeaway

The MACD indicator is useful, but it should not be used alone. A beginner-friendly rule is simple: do not trade the crossover by itself.
Instead, check the trend, the zero line, support and resistance, histogram behavior, and volume. If several signals point in the same direction, the chart may be worth watching more closely. If the signals are mixed, patience is often better than forcing a trade.
MACD is not a magic indicator. It is a momentum tool that helps investors organize what the chart is already showing. The real value of MACD is not in finding a perfect buy or sell button. The real value is learning how to read momentum inside the larger chart structure.
Final Thoughts
The MACD indicator can be very helpful for beginner investors, especially when markets feel confusing. But the key is to avoid using it mechanically.
A bullish crossover below the zero line is not the same as a bullish crossover above the zero line. A bearish crossover near resistance is not the same as a bearish crossover after a small pullback in a strong uptrend. This is why context matters.
When I stopped treating MACD as a signal generator and started using it as a momentum confirmation tool, the chart became much easier to understand. MACD does not remove risk. It does not guarantee the next move. But it can help you slow down, compare signals, and make more structured decisions.
Use MACD as one part of your chart-reading routine, not as a standalone prediction tool.
❓ FAQ
Q1. Is MACD good for beginners?
Yes. MACD is useful for beginners because it visually shows changes in momentum. However, it should not be used alone as a buy or sell signal.
Q2. What is the best MACD setting?
The most common MACD setting is 12, 26, 9. Most beginners can start with this default setting before trying to adjust anything.
Q3. Why is the MACD zero line important?
The zero line helps show whether momentum is in a stronger bullish zone or a weaker bearish zone. A crossover above zero and a crossover below zero can have different meanings.
Q4. Should I use MACD with RSI?
Yes. MACD and RSI can work well together because they show different types of information. MACD focuses on momentum changes, while RSI helps identify whether price may be overbought or oversold.
Q5. Is MACD better for daily charts or short-term charts?
For beginners, daily and weekly charts are usually easier to read because they reduce noise. Short-term charts can produce many false signals.
Q6. Can MACD predict the future?
No. MACD does not predict the future. It reacts to price movement and helps investors understand momentum more clearly.
📚 Related Articles
Moving Averages in Stocks: The Ultimate Guide to Clear Trend Reading
RSI Indicator Explained for Beginners: How to Read Momentum Without Overreacting
How to Read Bollinger Bands: 5 Beginner Mistakes to Avoid
Trading Volume for Beginners: How to Read It With Price Action

Stock Valuation Checklist: 7 Critical Checks Before Calling a Stock Cheap
A stock can look cheap because its price has fallen 40%, its P/E ratio is…
RSI Divergence vs MACD Crossover: Which Is More Reliable for Trading?
RSI divergence can warn that price momentum is weakening before a reversal becomes obvious. A…

Before You Buy the Dip: 5 Critical Balance Sheet Checks Every Investor Should Make
A stock that falls 20%, 30%, or even 50% can suddenly look cheap. But a…
Disclaimer: This article is for educational purposes only. It is not financial advice or a recommendation to buy or sell any specific stock, ETF, cryptocurrency, or other asset. All investment decisions are your own responsibility.
Pingback: RSI Indicator Explained for Beginners: How to Read Momentum Without Overreacting
Pingback: How to Read Bollinger Bands: 5 Beginner Mistakes to Avoid