
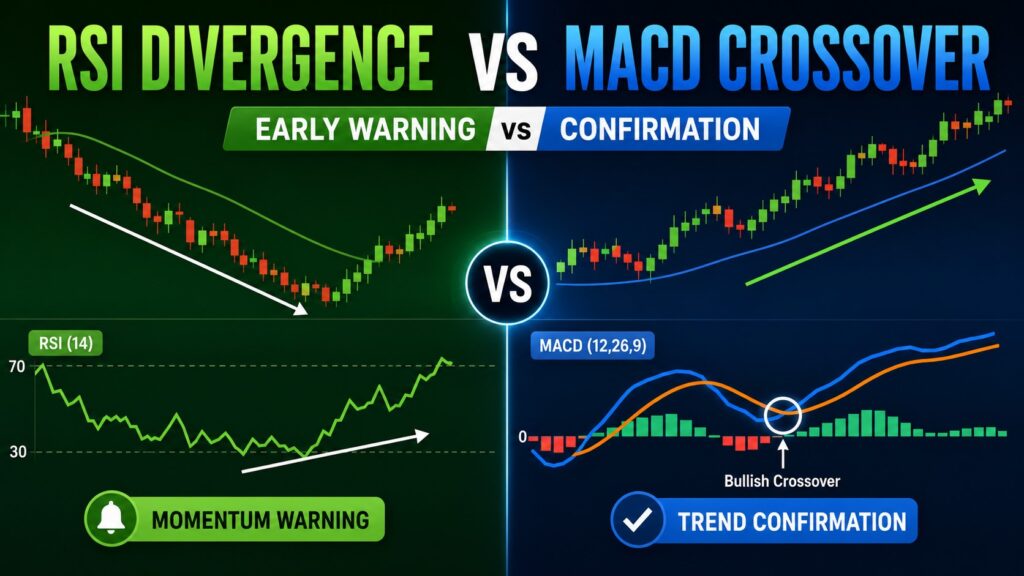
RSI divergence can warn that price momentum is weakening before a reversal becomes obvious. A MACD crossover may appear later in the same reversal process, after price has moved enough to change the relationship between the MACD and its signal line.
That makes RSI Divergence vs MACD Crossover less about finding one superior indicator and more about giving each signal the right job.
RSI divergence asks whether momentum still confirms price. MACD asks whether momentum has shifted enough to create a crossover signal.
Neither one can reliably predict the next price move by itself.
A more practical sequence is:
Trend → Momentum → Confirmation
Start with the price trend. Use RSI to evaluate momentum. Then look to MACD and price structure for additional confirmation.
RSI Divergence vs MACD Crossover: What Is the Difference?
The Relative Strength Index, or RSI, is a momentum oscillator that moves between 0 and 100. Traditional reference levels are 70 for overbought conditions and 30 for oversold conditions.
Those levels are not automatic reversal signals. During a strong trend, RSI can remain overbought or oversold for an extended period. Fidelity’s RSI indicator guide explains the traditional 70/30 reference levels and notes that divergence—when price makes a new high or low that RSI does not confirm—can be a potential reversal signal.
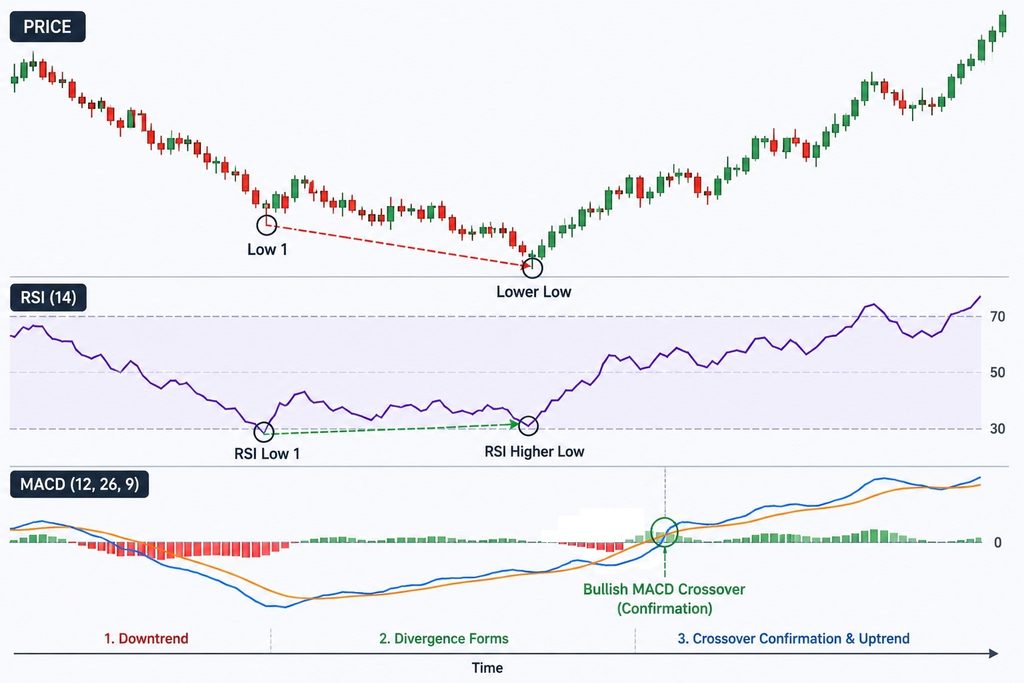
A bullish RSI divergence occurs when price makes a lower low while RSI makes a higher low.
A bearish RSI divergence occurs when price makes a higher high while RSI makes a lower high.
The signal is therefore about disagreement between price and momentum.
MACD approaches momentum differently. Its standard calculation subtracts a 26-period exponential moving average from a 12-period EMA. A commonly used 9-period EMA of the MACD line becomes the signal line.
When the MACD line crosses above the signal line, the crossover is considered bullish. A move below the signal line is considered bearish. Fidelity’s MACD indicator guide also notes that MACD is primarily used in trending conditions and can whipsaw during trading ranges.
| Signal | Main Role | Potential Advantage | Main Limitation |
|---|---|---|---|
| RSI divergence | Detect momentum disagreement | Can warn before a reversal is obvious | Divergence can persist while the trend continues |
| MACD crossover | Identify a momentum crossover | Can add confirmation after momentum changes | May appear after part of the move has occurred |
| Both together | Combine warning and confirmation | Provides more context | Cannot eliminate false signals |
The difficult choice for a trader is therefore not simply RSI or MACD.
It is early information versus additional confirmation.
Which Signal Can Appear Earlier?
In reversal setups, RSI divergence can sometimes develop while the existing price trend is still intact.
Consider a hypothetical stock that falls from $60 to $54, rebounds, and then drops to $51.
At $54, RSI reaches 24.
At the lower price of $51, RSI reaches 31.
The pattern is:
Price: lower low
RSI: higher low
That is bullish RSI divergence.
The second price low occurred with weaker downside momentum according to RSI. But that does not establish that $51 is the final bottom.
Price could move sideways, decline again, or produce another divergence before a durable reversal begins.
This is an important distinction in RSI Divergence vs MACD Crossover: an earlier signal is not automatically a more reliable one.
When I evaluate this type of setup, the first thing I would check after the divergence is whether price stops making lower lows. Without some change in price structure, the divergence remains a warning rather than confirmation.
Why MACD Can Be More Useful for Confirmation
Suppose the same stock rebounds from $51 to $53, pulls back to $52, and then advances toward $55.
When comparing RSI Divergence vs MACD Crossover, this timing difference creates an important trade-off. The bullish RSI divergence was already visible near the low, while a bullish MACD crossover may not occur until after part of the recovery has developed.
That timing makes sense because MACD is calculated from moving averages of price. However, the exact order is not guaranteed; indicator settings and the path price takes can change when each signal appears.
Waiting for MACD therefore creates a trade-off.
The trader may miss the exact bottom, but receives another piece of evidence that recent momentum has changed.
I would not interpret the crossover in isolation either. What I would want to know next is whether price is also forming a higher low, recovering above resistance, or otherwise changing its previous downtrend structure.
The better question is not simply:
Did MACD cross?
It is:
Did the crossover occur while price structure was improving?
RSI and MACD in a Strong Uptrend
Strong trends are where bearish RSI divergence can be especially tempting.
Imagine a stock repeatedly making higher highs and higher lows. RSI reaches 73, falls back, then forms a lower high even as the stock makes another price high.
A bearish divergence now exists.
That does not mean the uptrend must end.
Momentum can weaken while price continues rising. RSI can also remain elevated during strong trends for longer than a trader expects.
Rather than treating the divergence as an immediate sell signal, I would focus on what price does afterward.
Does the stock break its previous higher low? Does a breakout fail near resistance? Does MACD begin losing momentum as well?
In a strong uptrend, the broader trend generally deserves more weight than one early warning from an oscillator.
RSI and MACD in a Strong Downtrend
The same problem appears in reverse.
A stock may continue making lower highs and lower lows, then form bullish divergence as RSI makes a higher low.
The signal means downside momentum is no longer confirming the latest price low.
It does not mean the bottom has been identified.
This is where RSI Divergence vs MACD Crossover becomes useful as a role-based comparison. RSI may tell you that the decline deserves closer attention, while a later bullish MACD crossover can add evidence that momentum has shifted further.
The questions become:
RSI: Is downside momentum weakening?
MACD: Has the momentum relationship changed enough to create a bullish crossover?
Price still decides whether the potential reversal actually develops.
Sideways Markets Can Make Both Signals Noisy
A range-bound market creates a different problem.
Suppose a stock repeatedly moves between $48 and $52 without establishing a clear direction.
MACD may cross above its signal line, then below it, then above it again. These mathematical crossovers are real, but they may have limited usefulness because no sustained trend develops.
This repeated behavior is the whipsaw risk identified in the MACD documentation.
RSI signals can also become less convincing when small price swings create minor divergences without meaningful follow-through.
In this environment, the first things I would check are the actual range boundaries.
Where is support? Where is resistance? Has price genuinely broken outside the range, and is that breakout holding?
Sometimes conflicting or noisy indicators do not mean that one indicator is wrong. They mean the market environment itself lacks direction.
When RSI Divergence and MACD Crossover Can Fail
A useful RSI Divergence vs MACD Crossover comparison has to include failure conditions.
Divergence During a Powerful Trend
Bearish divergence can appear while a strong rally continues. Bullish divergence can appear well before a major decline reaches its final low.
The mistake is assuming that weakening momentum requires an immediate reversal.
It does not.
MACD Crossovers Inside a Tight Range
When price repeatedly changes direction, MACD can generate several crossovers without a durable move developing.
The crossover may accurately describe a short-term momentum change while still being a poor standalone trading signal.
Weak Divergences
A tiny difference between two RSI peaks is not necessarily as meaningful as a clear divergence developing after an extended price move.
Location matters too. A divergence near an established support or resistance area usually provides more context than one occurring in the middle of a directionless chart.
Ignoring Price Structure
This is the most important failure.
A bullish RSI divergence should not make continuing support breakdowns disappear. A bullish MACD crossover should not make major overhead resistance irrelevant.
Indicators are derived from price. They should support the reading of the chart rather than replace it.
What If RSI and MACD Disagree?
One of the most important questions in RSI Divergence vs MACD Crossover is what to do when the two signals do not appear at the same time.
Suppose price makes a lower low while RSI makes a higher low.
Bullish divergence has formed.
MACD, however, remains below its signal line.
At first glance, the two indicators seem to disagree.
They may actually be describing different stages of a potential transition.
RSI is showing that downside momentum weakened relative to the previous low. MACD is showing that a bullish signal-line crossover has not yet developed.
Nothing requires those events to happen at the same time.
If price later forms a higher low, MACD turns bullish, and resistance breaks, the earlier divergence now has more evidence behind it.
If price instead breaks support and downside momentum accelerates, the divergence failed to develop into a reversal.
That is why disagreement between indicators can be informative. It may show that momentum has begun to change while price confirmation remains incomplete.
A Practical Framework: Trend → Momentum → Confirmation
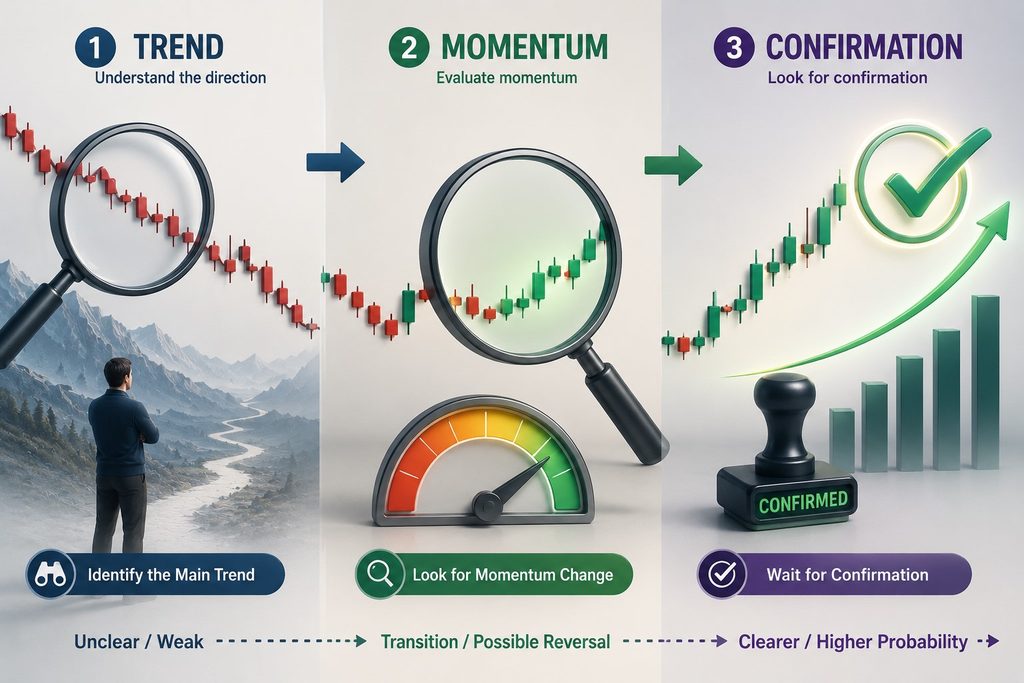
The most practical way to use RSI Divergence vs MACD Crossover is to stop asking which indicator deserves complete control over the decision.
Give each stage one job.
Step 1: Trend
Start with price.
Ask whether price is making higher highs and higher lows, lower highs and lower lows, or moving sideways.
Also identify nearby support and resistance.
A bullish divergence inside an aggressive downtrend is not the same setup as a bullish divergence forming near long-established support after an extended decline.
Step 2: Momentum
Then examine RSI.
Ask whether momentum confirms the latest price move.
A higher price high combined with a lower RSI high suggests upward momentum has weakened relative to the previous peak.
A lower price low combined with a higher RSI low suggests downside momentum has weakened.
This is the warning stage.
Something has changed, but the trend may still be intact.
Step 3: Confirmation
Finally, look for evidence that the warning is developing into an actual change in market structure.
A MACD crossover can be one piece of that evidence. Price forming a higher low or breaking resistance can be another.
A hypothetical bullish sequence might look like:
Downtrend → Bullish RSI divergence → Higher low → Bullish MACD crossover → Resistance break
The sequence will not always be this clean, and waiting for every condition can result in reacting very late.
The framework is not a mechanical trading system. Its purpose is to prevent one indicator from carrying the entire decision.
Hypothetical Example: Warning First, Confirmation Later
Consider a stock in an established downtrend.
Its price moves:
$72 → $64 → $67 → $61
At $64, RSI reaches 26.
When price later falls to $61, RSI reaches 33.
Price has made a lower low while RSI has made a higher low. Bullish divergence is now visible.
Nobody knows at that point whether $61 will be the final low.
Instead of assuming that divergence means “buy,” the trader watches what develops next.
Price rebounds from $61 to $64, then reaches $65. MACD eventually crosses above its signal line. Later, price moves through a short-term resistance area around $66.
The evidence has appeared in stages:
Trend: bearish initially
Momentum: downside momentum weakens
Confirmation: MACD turns bullish
Price structure: resistance breaks
Waiting means the exact $61 low is missed.
But finding the exact bottom was never the realistic objective. The more useful task is recognizing when a falling stock begins to produce evidence that the character of the decline may be changing.
This example shows why RSI Divergence vs MACD Crossover is more useful as a sequence than as a competition between two indicators. RSI can provide the earlier momentum warning, while MACD and price structure can help show whether that warning is developing into a more meaningful reversal.
So, Which Signal Is More Reliable?
There is no universal winner in RSI Divergence vs MACD Crossover, and without defining the asset, timeframe, indicator settings, entry rules, and testing method, it would be misleading to claim that one has a universally higher win rate.
Their usefulness depends on the job.
For an early warning that momentum no longer supports price as strongly as before, RSI divergence can be useful.
For additional confirmation after momentum has begun changing, a MACD crossover can be useful.
In a strong trend, price structure deserves substantial weight. Near an extended move or an important support or resistance area, divergence may deserve closer attention. In a directionless trading range, both indicators deserve more skepticism.
Earlier information comes with more uncertainty.
Additional confirmation usually comes at the cost of later timing.
Give Each Signal a Different Job
The final lesson from RSI Divergence vs MACD Crossover is not to choose one indicator and ignore the other.
Use a simple analytical sequence:
Trend → Momentum → Confirmation
First determine what price is doing. Then ask whether RSI momentum agrees with that move. Finally, look for evidence from MACD and price structure that a meaningful change is developing.
If the signals align, the setup has more context behind it.
If they disagree, that does not automatically mean one indicator has failed. The market may simply be between the early-warning stage and the confirmation stage.
That distinction is more useful than expecting either RSI or MACD to predict the market on its own.
FAQ
Q1. Is RSI divergence more reliable than MACD?
Not universally. In RSI Divergence vs MACD Crossover, RSI divergence can provide an earlier warning that momentum is weakening, while a MACD crossover can offer additional confirmation after price momentum has shifted. Reliability depends on the market environment, timeframe, settings, and the rules used to evaluate the signal.
Q2. Can RSI divergence and MACD crossover be used together?
Yes. One practical approach is Trend → Momentum → Confirmation. Identify the price trend first, use RSI to evaluate whether momentum confirms the move, and then use MACD together with price structure for additional confirmation.
Q3. What should I do when RSI and MACD disagree?
Do not automatically choose one indicator over the other. Determine whether RSI is providing an early momentum warning while MACD has not yet confirmed the change. Then check the underlying trend, support and resistance, and subsequent price structure before drawing a stronger conclusion.
📚 Related Articles
RSI Indicator Explained for Beginners: How to Read Momentum Without Overreacting
MACD Indicator Explained: A Smart Beginner’s Guide to Better Chart Reading
How to Read Stock Chart Trends: A Smart Beginner’s Guide

Stock Valuation Checklist: 7 Critical Checks Before Calling a Stock Cheap
A stock can look cheap because its price has fallen 40%, its P/E ratio is…

Before You Buy the Dip: 5 Critical Balance Sheet Checks Every Investor Should Make
A stock that falls 20%, 30%, or even 50% can suddenly look cheap. But a…

Inverted Yield Curve: A Critical Guide to Avoid Costly Recession Mistakes
You see a headline saying the Treasury yield curve has inverted. Recession warnings suddenly appear…
Disclaimer: This article is for educational and informational purposes only and is not personalized financial or investment advice. Investment decisions should be based on your own circumstances, research, risk tolerance, and, when appropriate, professional guidance.