

Two stocks have the same P/E ratio of 20×.
Both earn $5 per share and trade at $100. On a stock screener, they appear equally valued.
Now suppose one company can grow with relatively little additional capital, converts its earnings into cash consistently, and carries modest debt. The other needs heavy reinvestment to grow and has a more leveraged balance sheet.
Do these stocks really deserve the same P/E ratio?
Not necessarily.
P/E tells you how much investors are paying relative to earnings. It does not tell you how those earnings were produced, what it costs to grow them, or how much risk sits behind them.
To see why that matters, let’s run a simple experiment.
The Experiment: Two Stocks, One P/E
Meet two hypothetical companies: Atlas and Beacon.
We deliberately make them identical.
| Metric | Atlas | Beacon |
|---|---|---|
| Stock Price | $100 | $100 |
| EPS | $5.00 | $5.00 |
| P/E Ratio | 20× | 20× |
| Revenue Growth | 10% | 10% |
| Debt | Initially equal | Initially equal |
| Cash Generation | Initially equal | Initially equal |
For both companies:
P/E Ratio = $100 ÷ $5 = 20×
The P/E ratio compares a company’s stock price with its earnings per share, making it a simple starting point for comparing valuation across companies.
Test 1: What If Their Growth Expectations Differ?
Atlas is expected to grow earnings by 5% annually. Beacon is expected to grow by 15%.
Everything else remains equal.
| Metric | Atlas | Beacon |
|---|---|---|
| Current EPS | $5.00 | $5.00 |
| P/E Ratio | 20× | 20× |
| Hypothetical Expected Earnings Growth | 5% | 15% |
Investors are paying the same multiple for businesses with different expected growth.
That does not prove Beacon is undervalued. Its growth forecast could be wrong or carry greater uncertainty.
It does show that a same P/E ratio does not necessarily represent the same expectations.
Result #1: A multiple cannot be interpreted separately from the expectations behind it.
Test 2: What If Both Grow 15%, but One Needs More Capital?
Reset the experiment.
Both companies now grow earnings by 15%.
Atlas, however, can expand with relatively modest additional investment. Beacon requires substantially more spending on equipment, facilities, or working capital.
Suppose both produce $500 million in net income:
| Hypothetical Result | Atlas | Beacon |
|---|---|---|
| Net Income | $500M | $500M |
| Illustrative Additional Investment Need | $100M | $350M |
| Investment Need as % of Net Income | 20% | 70% |
These hypothetical figures are not a free-cash-flow calculation. They simply isolate the amount of additional investment required to support growth.
Both companies report the same earnings and growth rate, but Beacon needs far more capital to get there.
That difference matters because growth is not economically identical when one business must continually commit much more capital to produce it.
Result #2: Growth should be evaluated together with the reinvestment required to produce it.
Test 3: What If Their Cash Conversion Differs?
Keep EPS identical again.
This time, Atlas consistently converts a large portion of its accounting earnings into operating cash flow.
Beacon’s reported earnings are rising, but receivables and inventory are absorbing more cash.
That is not automatically a warning sign. Growing companies often need additional working capital, and business models differ.
But it raises a question that P/E cannot answer:
Is $1 of reported earnings from Atlas economically equivalent to $1 of reported earnings from Beacon?
To investigate, an investor would need to compare reported profit with operating cash flow, working-capital changes, capital expenditures, and free cash flow.
Result #3: Identical EPS can have different cash-flow characteristics.
Test 4: What If Their Balance Sheets Differ?
Now change the financing structure.
Atlas carries modest debt and has no major near-term refinancing pressure.
Beacon has substantially more debt and future refinancing needs.
Both still trade at $100 with $5 EPS.
Their P/E ratios remain 20×.
But if operating profit falls, the companies may have very different financial flexibility. Interest costs and refinancing obligations can place greater pressure on a highly leveraged business.
Debt does not automatically make a company unattractive. Its significance depends on cash-flow stability, borrowing costs, maturities, and how the capital is used.
The important point is that P/E does not capture these balance-sheet differences.
Result #4: The same multiple can sit on top of different financial risks.
Test 5: What Happens When the Market Prices the Difference?
Now suppose investors begin assigning Atlas a premium for its business characteristics.
Atlas rises to $150 while EPS remains $5:
Atlas: $150 ÷ $5 = 30× P/E
Beacon remains at $100:
Beacon: $100 ÷ $5 = 20× P/E
Beacon is cheaper relative to current earnings.
But that alone does not prove it offers better value.
Atlas may deserve some premium. The market may also have pushed that premium too far.
This creates the real valuation question:
How much should differences in growth, business economics, and risk actually be worth?
The Valuation Gap Test
When two comparable companies trade at different P/E ratios, treat the gap as something that needs an explanation.
P/E ratios can differ across companies because their underlying fundamentals differ, including expected growth and risk.
Suppose Atlas trades at 30× and Beacon at 20×. Atlas carries a 50% P/E premium.
Instead of immediately calling one expensive and the other cheap, investigate five areas.
Growth
Is the higher-multiple company expected to grow faster, and what assumptions support that expectation?
Reinvestment
How much additional capital is required to support that growth?
Cash Conversion
How consistently do reported earnings translate into cash?
Balance-Sheet Risk
How much debt exists, what does it cost, and when does it mature?
Durability
How vulnerable are future earnings to competition, cyclicality, customer concentration, or other material business risks?
The Valuation Gap Test does not calculate a perfect P/E.
It asks a more useful question:
What is the market paying a premium for—and is that explanation supported by the business?
How to Compare Stocks With the Same P/E Ratio
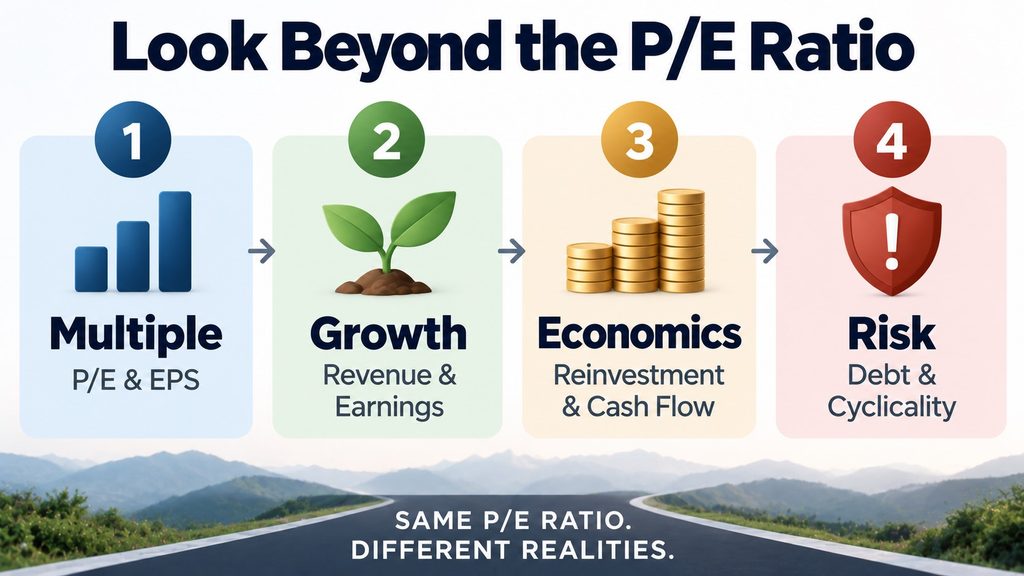
The Atlas-versus-Beacon experiment can be turned into a practical four-layer check.
| Layer | Core Question | What to Check |
|---|---|---|
| 1. Multiple | What am I paying relative to earnings? | Current or forward P/E, EPS used, relevant peers |
| 2. Growth | How could earnings change? | Revenue growth, EPS growth, margins, growth assumptions |
| 3. Economics | What does growth require? | CapEx, working capital, operating cash flow, free cash flow |
| 4. Risk | How fragile are those earnings? | Debt, interest expense, maturities, cyclicality |
This framework changes how you compare P/E ratios.
If two companies have the same P/E ratio, do not assume they are equally valued. Move through the other three layers and test whether their growth, business economics, and risks are actually comparable.
If their P/E ratios differ, reverse the process: identify which differences might explain the premium or discount.
The framework will not produce a universally correct multiple. Its purpose is to reveal what the headline P/E leaves out.
Conclusion: Start With P/E, Then Explain It
Atlas and Beacon began at the same price, the same EPS, and the same P/E ratio.
Then we changed growth, reinvestment, cash conversion, and financial risk one at a time.
The experiment reveals the central problem with comparing valuation multiples mechanically:
Two stocks can have the same multiple without having the same economics.
A higher-quality business may reasonably command a higher multiple, but no premium is automatically justified. Likewise, a lower P/E does not by itself establish undervaluation.
So instead of stopping at “20× versus 20×” or “20× versus 30×,” ask:
What would have to be similar about these businesses for their P/E ratios to make sense?
P/E gives you the starting number.
Valuation begins when you explain what is behind it.
FAQ
Q1. Is a lower P/E stock always cheaper?
It is cheaper relative to the earnings used in the calculation, but that does not establish that it is undervalued. Differences in growth, business economics, and risk can help explain a lower multiple.
Q2. Can two stocks with the same P/E ratio have different valuation characteristics?
Yes. Identical P/E ratios can sit on top of different growth expectations, reinvestment requirements, cash-flow characteristics, and financial risks.
Q3. What should I check when comparing P/E ratios?
Start with the multiple, then examine expected growth, the investment required to support that growth, cash conversion, and financial risk. The objective is to understand what the P/E does not show.
Disclaimer: This article is for educational and informational purposes only and is not personalized financial or investment advice. Atlas, Beacon, and all numerical scenarios are hypothetical examples created solely to illustrate valuation concepts.
📚 Related Articles
Free Cash Flow Explained: Why Profitable Companies Can Still Run Into Trouble
Revenue vs Profit: Why Strong Sales Growth Can Mislead Investors
Before You Buy the Dip: 5 Critical Balance Sheet Checks Every Investor Should Make

High Interest Rates and the Economy: Why Can Growth Stay Strong?
If high interest rates are supposed to slow the economy, why can consumers keep spending,…

Can AI Become a Monopoly? Where the Real Economic Moats Are
Artificial intelligence appears to have many ingredients that could produce powerful monopolies. Training frontier models…

Can Big Tech Maintain Its Profit Margins in the AI Era?
Artificial intelligence is creating new revenue opportunities for Big Tech, but it is also changing…