
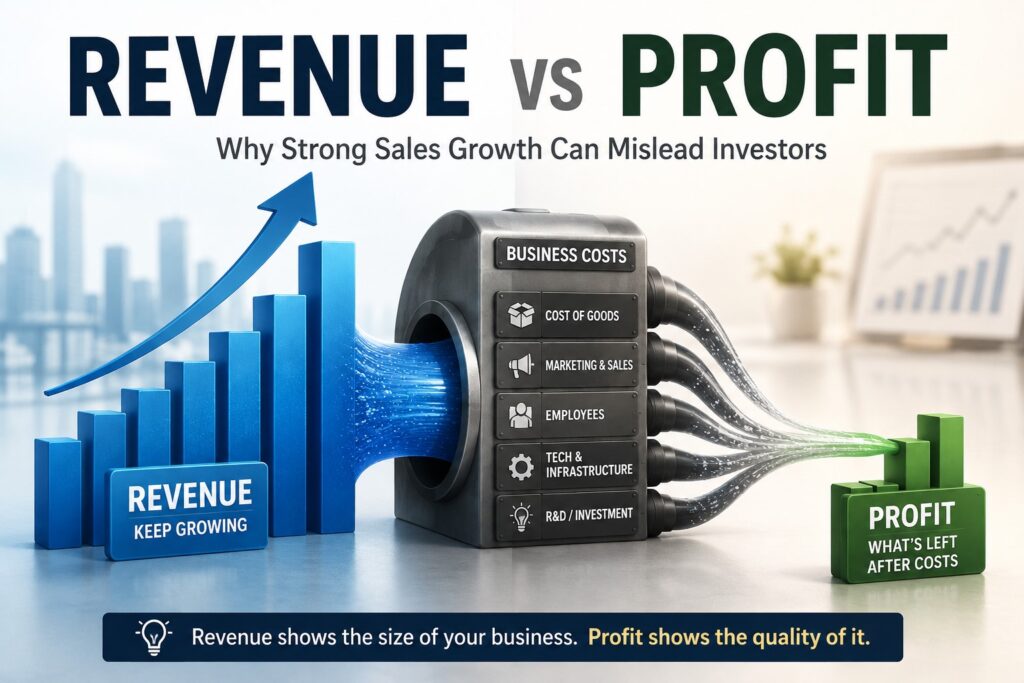
A company reports 30% sales growth. The headline looks impressive, and it is easy to assume the business is getting stronger.
But what if its costs increased 45%?
What if the company needed heavy discounts, more advertising, additional employees, or expensive infrastructure just to generate those extra sales?
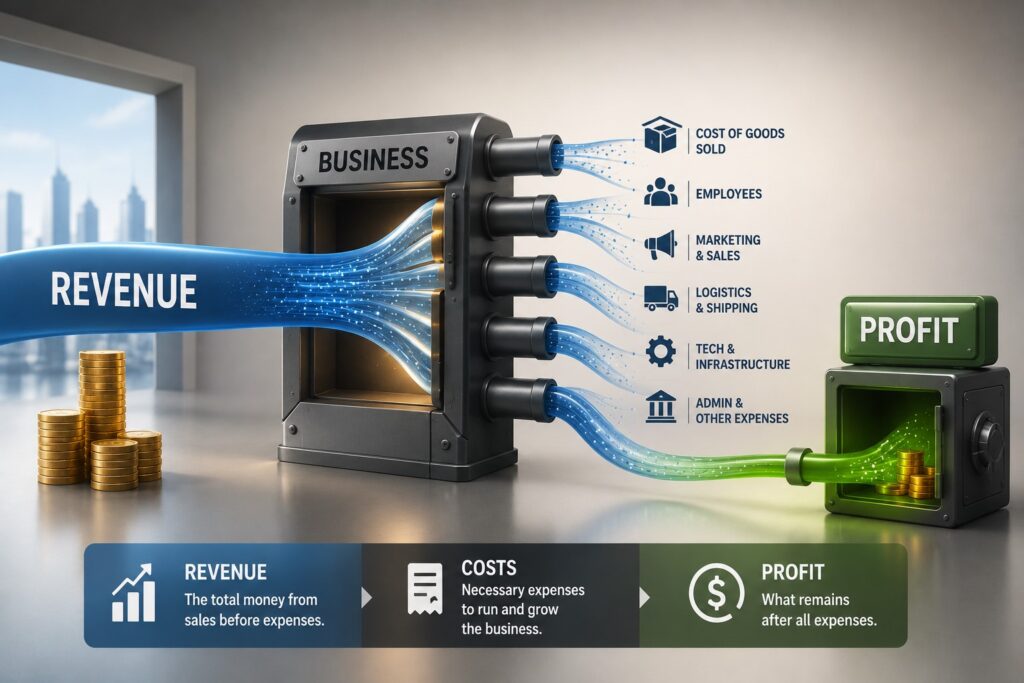
This is why understanding Revenue vs Profit matters. Revenue shows how much a company generates from selling goods or services. Profit shows how much remains after relevant costs and expenses are deducted.
A company can grow sales rapidly while becoming less profitable—or even losing more money.
For investors, the useful question is not simply, “How fast are sales growing?”
It is: What did the company have to spend to create that growth, and are the economics improving as the business gets larger?
What Is Revenue?
Revenue is the money a company generates from its normal business activities before expenses are deducted.
Investor.gov, the investor-education website of the U.S. Securities and Exchange Commission, defines revenue as the amount generated through the sale of a company’s goods and services.
For a simple hypothetical business:
Revenue = Price × Quantity Sold
If a company sells 100,000 products for $50 each:
100,000 × $50 = $5 million in revenue
Revenue is often called the top line because it appears near the top of the income statement.
Growing revenue can reflect more customers, higher prices, increased sales volume, new products, or expansion into new markets.
But revenue alone does not show how expensive those sales were to generate.
What Is Profit?
Profit is what remains after costs are deducted from revenue. Investor.gov defines profit as revenue minus cost.
Investors commonly encounter several levels of profit on an income statement.
Gross profit is revenue minus the direct costs of producing goods or delivering services.
Operating profit, often called operating income, takes gross profit and subtracts operating expenses such as selling, marketing, research, and administrative costs.
Net income goes further and reflects the company’s final accounting profit after applicable expenses, interest, taxes, and other items. Investor.gov defines net income as profit remaining after expenses and taxes have been deducted from revenue
This distinction is the foundation of Revenue vs Profit analysis.
Revenue shows the scale of business activity. Profit helps show how much of that activity translates into earnings.
Revenue vs Profit: A Simple Example
Consider two hypothetical companies with the same annual revenue.
| Metric | Company A | Company B |
|---|---|---|
| Revenue | $100 million | $100 million |
| Total Expenses | $80 million | $98 million |
| Net Profit | $20 million | $2 million |
| Net Profit Margin | 20% | 2% |
The companies look identical if you focus only on sales.
Their profitability tells a very different story.
Company A keeps $20 of net profit for every $100 of revenue. Company B keeps only $2.
Now suppose Company B increases revenue from $100 million to $140 million.
That 40% growth sounds excellent.
But if expenses rise from $98 million to $145 million, the company moves from a $2 million profit to a $5 million loss.
Sales increased dramatically. The business did not necessarily become financially stronger.
Quick Investor Takeaway
Rising Revenue + Rising Profit: Encouraging, but check whether margins and cash generation are improving too.
Rising Revenue + Falling Profit: Determine whether the cause is productive reinvestment or weakening business economics.
Flat Revenue + Rising Profit: Efficiency may be improving, but cost cutting alone cannot support revenue growth indefinitely.
A Real Example: Amazon’s Early Growth Years
Amazon provides a useful historical example because its early financial statements show why investors should examine sales growth and profitability together.
According to Amazon’s 2001 Form 10-K filed with the SEC, net sales rose from approximately $1.64 billion in 1999 to $2.76 billion in 2000 and $3.12 billion in 2001. That represented revenue growth of 68% in 2000 and another 13% in 2001.
Yet the company reported net losses of approximately $720 million in 1999, $1.41 billion in 2000, and $567 million in 2001.
Strong sales growth did not mean Amazon was already profitable.
But looking only at the losses would also have missed important changes underneath the headline numbers. In 2001, Amazon’s fulfillment expenses declined to 12% of net sales from 15% in 2000, while marketing expenses declined to 4% from 7%.
That does not mean every loss-making growth company deserves patience. Amazon’s later success cannot be used as evidence that another unprofitable business will eventually succeed.
The narrower lesson is more useful: investors should examine whether the economics are improving as the company grows.
Why Can Revenue Grow While Profit Falls?
Three common mechanisms can create the gap. Understanding these drivers makes Revenue vs Profit analysis much more useful than comparing two headline numbers alone.
1. The Cost of Producing Each Sale Is Rising
Fast sales growth becomes less attractive when direct costs rise even faster.
Consider a hypothetical company:
Year 1
- Revenue: $100 million
- Cost of goods sold: $60 million
- Gross profit: $40 million
- Gross margin: 40%
Year 2
- Revenue: $120 million
- Cost of goods sold: $78 million
- Gross profit: $42 million
- Gross margin: 35%
Revenue increased 20%, and gross profit still rose slightly.
But gross margin fell from 40% to 35%.
The company is keeping less gross profit from each dollar of sales.
That does not automatically indicate a weak business. Temporary input-cost inflation, production inefficiencies, or expansion costs could explain the change.
The more useful question is:
Why is each dollar of revenue becoming less profitable?
2. The Company Is Paying Heavily for Growth
Customer acquisition, discounts, promotions, and subsidies can increase sales while weakening short-term economics.
Think about a delivery platform, subscription service, or online marketplace trying to grow quickly.
A business might offer large discounts to attract users or spend heavily on advertising to acquire new customers.
Suppose it spends $20 to acquire a customer who initially generates only $15 in gross profit.
Revenue may rise, but the initial economics of that customer are negative.
The important distinction is whether the spending produces lasting value.
If customers remain for years, make repeat purchases, and become cheaper to serve over time, the initial expense may prove productive.
If the company must continually spend heavily just to replace customers or generate the next sale, the growth may be structurally expensive.
When evaluating Revenue vs Profit, I would therefore want to know not only how quickly sales are growing, but whether customer economics improve as the company scales.
3. Operating Expenses Are Growing Faster Than Revenue
A company can have healthy demand while expanding payroll, research, or infrastructure faster than sales.
A growing business may hire engineers, salespeople, managers, and support staff. It may enter new countries or invest in new infrastructure.
Suppose revenue rises 25% while operating expenses rise 50%.
Operating profit could fall even though customer demand remains strong.
The spending may still be reasonable if it supports future growth.
What investors eventually want to see is evidence of operating leverage—revenue growing faster than certain operating costs, allowing a larger share of incremental sales to contribute to operating profit.
Why Margins Make Revenue vs Profit More Useful
Margins convert profit into a percentage of revenue, making it easier to compare profitability across periods.
| Margin | Basic Calculation | What It Helps Show |
|---|---|---|
| Gross Margin | Gross Profit ÷ Revenue | Profit after direct production or service costs |
| Operating Margin | Operating Income ÷ Revenue | Profitability after operating expenses |
| Net Margin | Net Income ÷ Revenue | Final accounting profitability |
Suppose revenue increases from $500 million to $600 million.
That is 20% growth.
But operating income declines from $75 million to $60 million.
Operating margin falls from:
$75M ÷ $500M = 15%
to:
$60M ÷ $600M = 10%
Sales improved while operating profitability weakened.
This is why margin trends can reveal information that the revenue-growth percentage alone cannot.
Is Falling Profit During Growth Always Bad?
No.
A company may deliberately accept lower current profitability while pursuing a larger future opportunity.
A software company might hire engineers to develop new products. A retailer may open additional stores. A semiconductor company could increase research spending. A business entering a new market may need infrastructure before that market contributes meaningful profit.
But “investing for growth” does not prove that the investment will work. This is one reason Revenue vs Profit should be evaluated alongside margins, operating expenses, and cash generation.
Some spending creates productive assets, stronger customer relationships, or better future economics.
Other spending simply produces expensive growth.
This is where I would look beyond the current profit number.
I would want to know:
- Are gross margins stable or improving?
- Is customer acquisition becoming more efficient?
- Are operating expenses beginning to grow more slowly than revenue?
- Is cash generation improving as the company becomes larger?
The objective is not to demand maximum profit today.
It is to determine whether scale is gradually creating a better economic model.

Revenue, Profit, and Cash Flow Are Not the Same Thing
Revenue is an accounting measure, so reported revenue does not simply mean “cash collected during the period.”
Under FASB Topic 606 revenue-recognition guidance, companies follow an accounting framework governing when revenue from customer contracts is recognized.
For beginner investors, the important takeaway is simpler: revenue, profit, and cash flow answer different questions.
Revenue: How much business activity is being recorded?
Profit: How much accounting income remains after expenses?
Cash flow: How is cash actually moving through the business?
A company can therefore report accounting losses while its operating cash-flow picture tells a somewhat different story. Amazon’s 2001 filing, for example, reported a $567 million net loss and $120 million of net cash used in operating activities; the figures differed because operating cash flow includes adjustments for non-cash items and working-capital changes.
If you want to understand where these figures appear in company reports, How to Read Financial Statements: A Simple and Powerful Beginner’s Guide explains the three core financial statements step by step.
My Four-Step Revenue vs Profit Sanity Check
When I look at an earnings report, I treat the revenue-growth percentage as a starting point rather than a conclusion.
I would run the result through four questions before deciding whether the growth actually looks stronger.
1. What Drove Revenue Growth?
Identify the source.
Was growth driven by:
- more customers,
- higher prices,
- acquisitions,
- new products,
- geographic expansion,
- or promotions?
A 20% increase driven by sustainable customer demand can carry different implications from the same increase created largely through acquisitions or heavy discounting.
2. What Happened to Gross Margin?
Compare gross margin with prior periods.
If revenue is increasing while gross margin keeps declining, investigate why.
Temporary cost pressure creates a different problem from a business model that becomes less profitable as it scales.
3. Are Operating Expenses Growing Faster Than Revenue?
Rapid expense growth can be reasonable during an investment period.
But there should be an economic purpose behind it.
Over time, I would want to see evidence that at least some costs can grow more slowly than revenue.
4. Is the Business Moving Toward Sustainable Economics?
For a profitable company, check whether margins and cash generation remain healthy.
For an unprofitable company, look for evidence that losses are becoming more manageable relative to the size of the business.
There is no single ratio that settles the question. A useful Revenue vs Profit comparison should show whether the economics are strengthening or weakening as the business grows.
The direction of the economics matters more.
Three Common Beginner Mistakes
Mistake 1: Assuming Fast Sales Growth Means a Great Business
Revenue growth is useful, but growth purchased at an unsustainable cost may create little economic value.
The quality of growth matters alongside the growth rate.
Mistake 2: Looking Only at Net Income
Net income matters, but it is the final result of many moving parts.
If profitability changes sharply, gross margin and operating margin can help identify where the change occurred.
Mistake 3: Assuming Every Loss-Making Growth Company Is Bad
The opposite shortcut can also mislead investors.
Some companies deliberately accept lower current profitability while expanding.
The useful question is whether the underlying economics show a credible path toward improvement.
For a broader approach to evaluating a company beyond one financial metric, Fundamental Analysis for Beginner Investors: A Smart Guide to Better Stock Decisions explains how investors can combine financial performance, business quality, and valuation.
Revenue Growth Is Only One Part of Business Quality
Revenue matters. Without customers willing to pay for a company’s products or services, there is no durable business to analyze.
But Revenue vs Profit analysis shows why sales growth should be the beginning of the investigation rather than the final verdict.
When revenue rises, check margins.
When profit falls, understand why.
When management says it is investing for growth, look for evidence that the economics improve as the company scales.
A strong sales number can tell you that a business is getting bigger.
Profitability and cash flow help you judge whether its economic quality may be improving too.
FAQ
Q1. Which Is More Important, Revenue or Profit?
Neither should be analyzed alone. A Revenue vs Profit comparison helps investors see both the scale of the business and how effectively that activity converts into earnings.
Q2. Is Rapid Revenue Growth Always Good for a Stock?
No. Fast revenue growth may be encouraging, but it does not determine whether a stock is attractive. Margins, cash flow, balance-sheet strength, expectations, valuation, and the sustainability of growth also matter.
Q3. What Should I Check After Strong Revenue Growth?
Start by identifying what caused the growth. Then compare gross margin, operating expenses, operating margin, net income, and cash flow with prior periods. Revenue vs Profit becomes most useful when those trends are considered together.
📚 Related Articles
How to Read Financial Statements: A Simple and Powerful Beginner’s Guide
Fundamental Analysis for Beginner Investors: A Smart Guide to Better Stock Decisions
Is a Low P/E Ratio Always Better? 5 Costly Mistakes to Avoid

Stock Valuation Checklist: 7 Critical Checks Before Calling a Stock Cheap
A stock can look cheap because its price has fallen 40%, its P/E ratio is…

RSI Divergence vs MACD Crossover: Which Is More Reliable for Trading?
RSI divergence can warn that price momentum is weakening before a reversal becomes obvious. A…

Before You Buy the Dip: 5 Critical Balance Sheet Checks Every Investor Should Make
A stock that falls 20%, 30%, or even 50% can suddenly look cheap. But a…
Disclaimer: This article is for educational purposes only. It is not financial advice or a recommendation to buy or sell any specific stock, ETF, cryptocurrency, or other asset. All investment decisions are your own responsibility.