
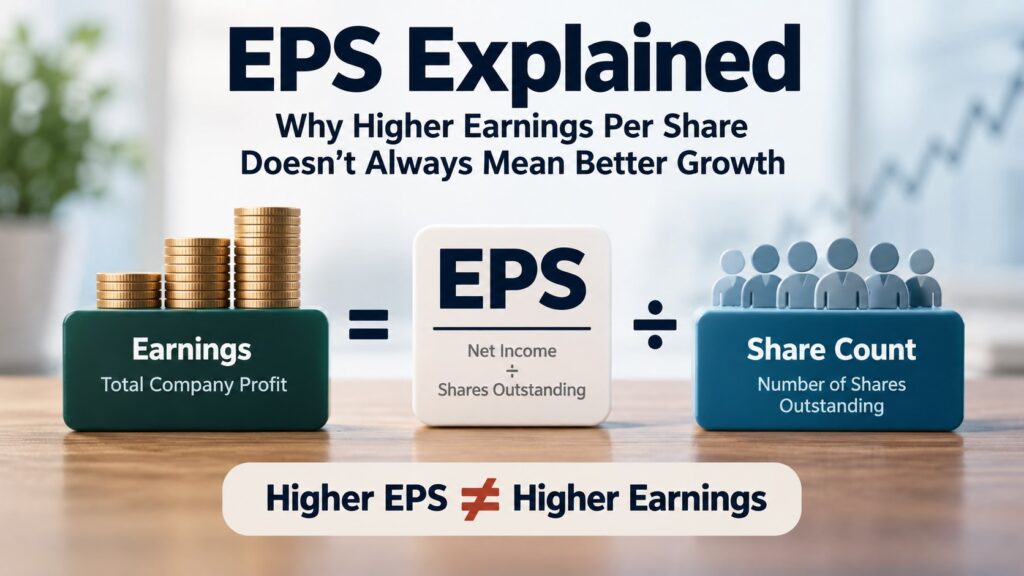
When a company reports earnings, investors often focus on one number: earnings per share, or EPS.
A higher EPS sounds like good news. If EPS increased from $5 to $6, it is easy to assume that the company became more profitable.
But that is not always what happened.
A company can increase EPS even when its total earnings do not grow. Share buybacks can reduce the number of shares outstanding, while stock issuance can dilute per-share earnings even when total profit rises.
That leads to a more useful question:
When EPS changes, what actually caused it?
This EPS explained guide goes beyond the basic formula. The goal is to understand where EPS growth comes from and how to separate business growth from per-share growth.
What Is EPS?
EPS, or earnings per share, measures the amount of a company’s earnings attributable to each common share.
A simplified formula is:
EPS = Earnings Available to Common Shareholders ÷ Weighted-Average Common Shares Outstanding
Suppose a hypothetical company reports:
- $500 million in earnings available to common shareholders
- 100 million weighted-average common shares
Its EPS is:
$500 million ÷ 100 million = $5.00 per share
If earnings increase to $600 million while the share count remains unchanged:
$600 million ÷ 100 million = $6.00 per share
EPS increased 20%.
In this example, the reason is straightforward: the company earned more money for common shareholders while the share count stayed the same.
But EPS can rise for another reason.
EPS Explained: How EPS Can Rise Without Earnings Growth
Suppose the same hypothetical company still earns $500 million.
This time, however, its weighted-average share count falls from 100 million to 90 million.
EPS becomes:
$500 million ÷ 90 million = approximately $5.56 per share
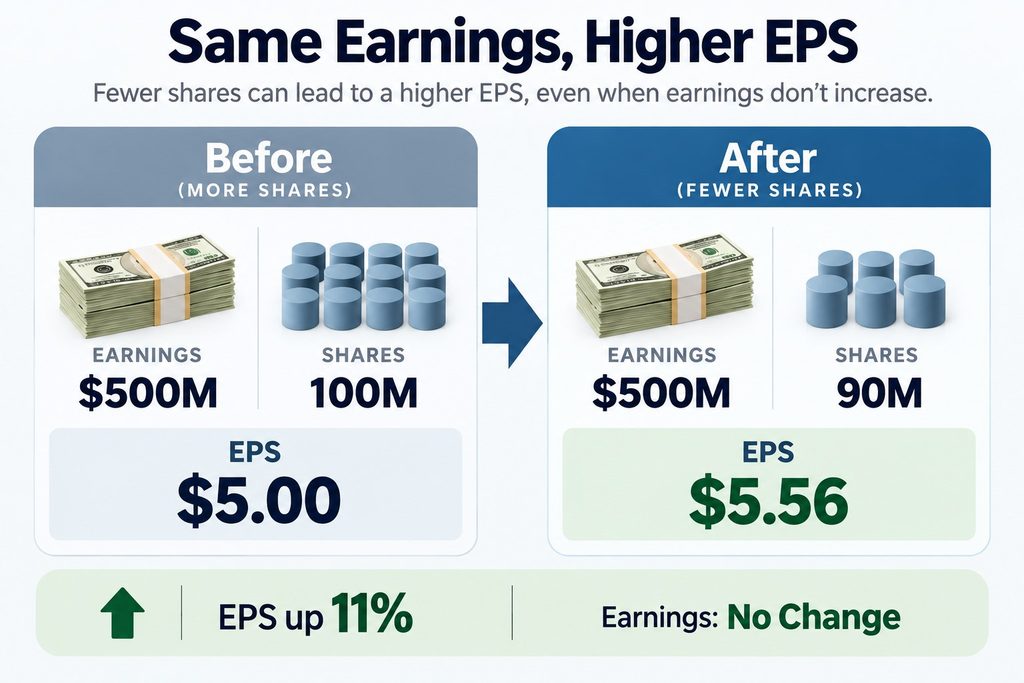
EPS increased about 11%, even though total earnings did not increase at all.
The same $500 million of earnings was divided among fewer shares.
This illustrates one of the most important ideas behind EPS:
EPS growth and business growth are not always the same thing.
Whenever EPS rises, compare it with both earnings and the diluted share count. That comparison can help reveal whether per-share growth came primarily from stronger profits, fewer shares, or a combination of both.
Why Share Buybacks Can Increase EPS
Share repurchases can reduce the number of shares participating in a company’s earnings.
Suppose a hypothetical company earns $1 billion.
With 200 million weighted-average shares, EPS is:
$1 billion ÷ 200 million = $5.00
If repurchases contribute to reducing the weighted-average share count to 180 million while earnings remain unchanged:
$1 billion ÷ 180 million = approximately $5.56
EPS increased even though the company generated exactly the same amount of profit.
That does not automatically make the buyback good or bad. A higher EPS tells you what happened on a per-share basis, but it does not tell you whether management paid a sensible price for the shares or whether the use of capital ultimately benefited shareholders.
Useful questions include:
- Did the diluted share count actually decline over time?
- At what valuation did the company repurchase its shares?
- Did the company take on significant debt to finance the repurchases?
- Were repurchases largely offsetting shares issued through stock-based compensation?
- What alternative uses of that capital were available?
A company can spend heavily on repurchases while making limited progress in reducing its diluted share count if it is also issuing substantial employee equity.
So when buybacks are contributing to EPS growth, examine earnings, diluted EPS, and diluted weighted-average shares together.
The Opposite Can Happen: Earnings Rise While EPS Falls
Share issuance can create the opposite effect.
Suppose a hypothetical company’s earnings increase from $100 million to $110 million.
That is a 10% increase in total profit.
But imagine its weighted-average share count increases from 50 million to 60 million.
EPS changes from:
$100 million ÷ 50 million = $2.00
to:
$110 million ÷ 60 million = approximately $1.83
The company earned more total profit, yet EPS declined.
The reason is straightforward: those earnings were divided among substantially more shares.
This is the effect of dilution on per-share earnings.
Dilution can reduce existing shareholders’ proportional ownership and per-share economics, but the reason for issuing new shares also matters. A company may issue equity to finance an acquisition, strengthen its balance sheet, compensate employees, or fund expansion.
What matters is whether the capital and resources associated with those additional shares eventually generate enough value and earnings to justify the larger share count.
Basic EPS vs. Diluted EPS
Company financial statements commonly report two EPS figures: basic EPS and diluted EPS.
Basic EPS generally uses the weighted-average number of common shares outstanding during the reporting period.
Diluted EPS incorporates the potential effect of instruments that could reduce EPS if they were converted or exercised and are considered dilutive under the applicable accounting rules. Depending on the company, these may include certain stock awards, options, warrants, or convertible securities.
Consider this simplified hypothetical example:
| Metric | Basic EPS | Diluted EPS |
|---|---|---|
| Earnings | $200 million | $200 million |
| Weighted-average shares | 100 million | 105 million |
| EPS | $2.00 | $1.90 |
In this simplified example, diluted EPS is lower because the same earnings are effectively spread across more shares.
The gap itself is not a verdict on the company. It shows that potential dilution is affecting the diluted calculation.
For investors analyzing long-term per-share growth, diluted EPS and diluted weighted-average shares can therefore provide useful context beyond basic EPS alone.
Why the Weighted-Average Share Count Matters
EPS does not normally use only the number of shares outstanding on the final day of the reporting period.
Instead, the calculation uses a weighted-average share count because the number of shares can change during the period.
Suppose a hypothetical company had:
- 100 million shares during the first half of the year
- 120 million shares during the second half
A simplified weighted-average calculation would be:
(100 million × 0.5) + (120 million × 0.5) = 110 million shares
Using 120 million shares for the entire year would incorrectly assume those additional shares existed throughout the full period.
This distinction becomes particularly important after large share issuances or repurchases. It also explains why the share count used in an EPS calculation may differ from the number of shares outstanding on a particular reporting date.
GAAP EPS vs. Adjusted EPS
Another complication appears during earnings season.
Alongside GAAP results, companies may present adjusted EPS, often as a non-GAAP financial measure. The SEC’s rules on non-GAAP financial measures establish requirements for how public companies present these measures.
Adjusted EPS generally modifies a GAAP measure by excluding or otherwise adjusting certain items. Depending on the company and reporting period, those adjustments may involve items such as:
- restructuring costs
- acquisition-related expenses
- impairment charges
- stock-based compensation in some company presentations
- certain gains or losses
- other company-specific adjustments
These measures can provide additional context, but investors should not automatically treat adjusted EPS as the “better” measure simply because it produces a higher number.
A practical way to evaluate adjusted EPS is:
Start with GAAP EPS → Identify each adjustment → Understand why it was made → Check whether similar adjustments recur → Compare with adjusted EPS
Repeated exclusions deserve particular attention. An expense described as unusual in one period may provide less useful insight into normalized performance if similar costs repeatedly appear.
Adjusted EPS can also differ in definition from one company to another, so comparisons require care.
Understanding exactly what management changed—and whether those adjustments recur—is more informative than comparing headline growth rates alone.
Why EPS Matters for the P/E Ratio
EPS matters beyond earnings reports because it is a key part of one of the most widely used valuation metrics:
P/E Ratio = Share Price ÷ Earnings Per Share
Suppose a hypothetical stock trades at $60 and has trailing EPS of $3.
Its P/E ratio is:
$60 ÷ $3 = 20
If EPS rises to $4 while the stock price remains at $60:
$60 ÷ $4 = 15
The P/E ratio fell even though the stock price did not change.
The calculation also shows why the quality and source of EPS matter for valuation.
A lower P/E produced by sustainable earnings growth may carry different implications from one produced by temporarily elevated earnings. Likewise, EPS boosted by a shrinking share count should be interpreted alongside how those repurchases were financed and what the company paid for its shares.
The P/E ratio provides a valuation relationship. It does not tell you by itself whether the earnings in its denominator are sustainable or high quality.
Four Things to Check When EPS Changes
EPS explained in practical terms is really about understanding what caused the number to change.
Instead of reacting immediately to a headline such as “EPS increased 20%”, work through four questions.
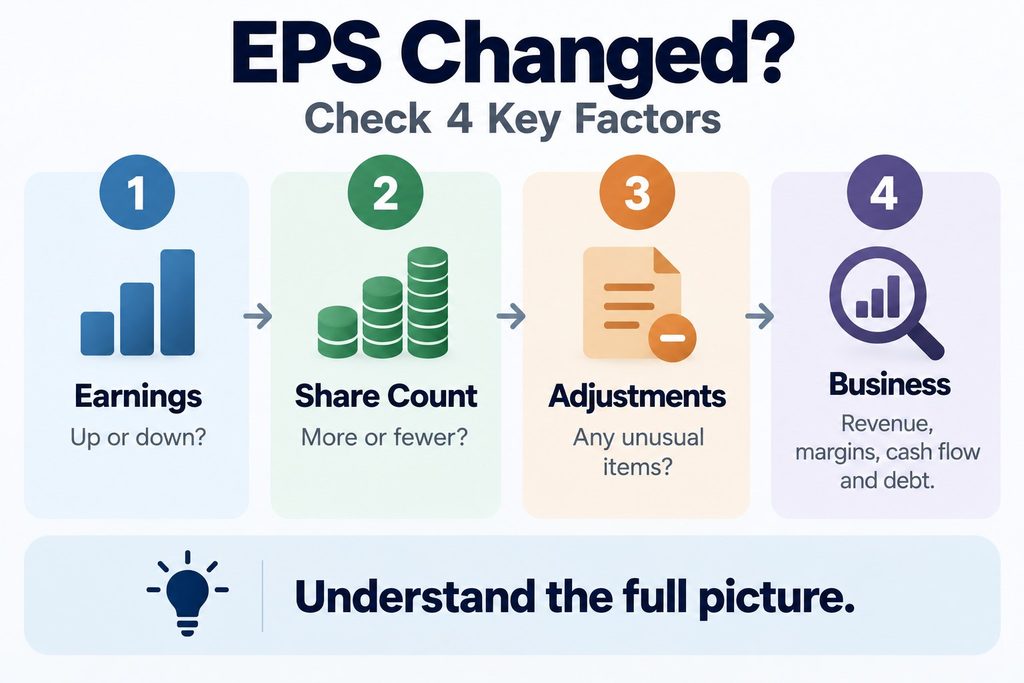
1. Did Total Earnings Increase?
Start with earnings attributable to common shareholders and review how they changed from prior periods.
If EPS increased 20% but total earnings increased only 5%, investigate what explains the difference.
A declining weighted-average share count may be contributing to the faster per-share growth.
2. Did the Diluted Share Count Change?
Next, examine diluted weighted-average shares over the same periods.
A falling share count can support EPS growth, while a rising share count can dilute it.
But direction alone is not enough. Find out why the share count changed.
Repurchases, employee stock compensation, acquisitions, convertible securities, and new equity issuance can affect the number in different ways.
3. Did Normal Business Operations Drive the Change?
Look for items that may make the current period difficult to evaluate against previous periods, including:
- asset sales
- restructuring charges
- impairments
- unusual tax effects
- acquisition-related expenses
- other significant gains or losses
A large unusual item can make one period’s EPS look much stronger or weaker without representing an equivalent change in the underlying operating business.
If management emphasizes adjusted EPS, also examine the reconciliation to the comparable GAAP measure and determine exactly what was excluded.
4. Does EPS Agree With the Rest of the Business?
Finally, place EPS alongside other financial measures.
| Metric | What to Check |
|---|---|
| Revenue | Is the company generating more sales? |
| Operating Margin | Is operating profitability improving or deteriorating? |
| Free Cash Flow | Are accounting earnings accompanied by cash generation over time? |
| Diluted Share Count | Are repurchases reducing shares, or is issuance creating dilution? |
| Debt | Is earnings growth accompanied by greater financial leverage? |
No single one of these measures proves that EPS growth is strong or weak. Together, they provide context.
For example, rising EPS alongside improving revenue, margins, and cash generation tells a different story from rising EPS accompanied by stagnant total earnings and a sharply declining share count.
These metrics do not replace EPS. They help explain where EPS growth came from.
Where Can Investors Find EPS?
For U.S. public companies, EPS information can be found in financial statements included in quarterly Form 10-Q and annual Form 10-K filings.
Depending on the filing and company, investors can examine information such as:
- basic EPS
- diluted EPS
- earnings attributable to common shareholders
- weighted-average shares
- potentially dilutive securities
- notes explaining the EPS calculation
You do not need to read an entire filing just to begin investigating an EPS change.
Start with the income statement and the relevant earnings-per-share footnote. If EPS changed sharply, trace the change back to earnings, weighted-average shares, and any material items affecting comparability.
The U.S. Securities and Exchange Commission’s EDGAR database provides free public access to company filings.
Common EPS Mistakes
One common mistake is assuming that a company with higher EPS is automatically a better investment.
EPS alone says nothing about the price investors are paying for those earnings, the company’s future growth prospects, balance-sheet risk, competitive position, or the durability of its profits.
Another mistake is looking at a single quarter without considering a longer trend.
Quarterly EPS can move because of seasonality, taxes, unusual expenses or gains, changes in the share count, and other temporary factors. Looking across several periods can help distinguish a persistent trend from a one-period change.
Perhaps the most important mistake is ignoring the denominator in the EPS formula.
A company can report rising EPS without increasing total earnings. Another company can increase total profit but report weaker EPS because its share count expanded.
That is why the source of EPS growth matters more than the headline number alone.
Final Takeaway: Look Beyond the Headline EPS Number
EPS is simple to calculate, but the headline number does not explain why it changed.
Higher EPS may reflect stronger underlying earnings, fewer shares, or other factors affecting reported per-share results. That is why the most informative question is not simply whether EPS went up or down, but what changed in the business and the share count to produce that result.
That is EPS explained in the way that matters most to investors: not just calculating the number, but understanding what caused it to change.
Disclaimer: This article is for educational purposes only. It is not financial advice or a recommendation to buy or sell any specific investment.
FAQ
Q1. Should investors compare EPS year over year or quarter over quarter?
Both can be useful, but the appropriate comparison depends on the business. For companies with meaningful seasonality, year-over-year comparisons can be especially useful because they compare similar periods. Looking across several quarters or years can provide additional context.
Q2. Can a company grow earnings while shareholders experience dilution?
Yes. Total earnings can increase while EPS grows more slowly—or even declines—if the weighted-average share count increases enough. The important question is whether the capital and resources associated with that dilution eventually generate sufficient additional value and earnings.
📚 Related Articles
How to Read Financial Statements: A Simple and Powerful Beginner’s Guide
Is a Low P/E Ratio Always Better? 5 Costly Mistakes to Avoid
Fundamental Analysis for Beginner Investors: A Smart Guide to Better Stock Decisions

Capitalized vs. Expensed Costs: How Expense Timing Changes Reported Profits
A company spends $100 million developing technology. If the cost is expensed today, current profit…

High Interest Rates and the Economy: Why Can Growth Stay Strong?
If high interest rates are supposed to slow the economy, why can consumers keep spending,…

Can AI Become a Monopoly? Where the Real Economic Moats Are
Artificial intelligence appears to have many ingredients that could produce powerful monopolies. Training frontier models…