
When a company reports earnings, one number often receives nearly as much attention as revenue or net income: earnings per share, or EPS.
For a beginner, EPS can look like just another accounting figure. It is more useful than that. EPS Explained properly means understanding how much of a company’s earnings are attributable to each common share—and why changes in the number of shares can change the story.
The basic formula is:
EPS = Earnings available to common shareholders ÷ Weighted-average common shares outstanding
Investor.gov defines earnings per share as a public company’s net profit divided by its number of common shares.
But the formula is only the starting point.
When EPS changes, investors should ask why.
Did the business earn more money? Did the company repurchase shares? Were additional shares issued? Could stock options or convertible securities increase dilution?
Those questions make EPS useful as an analytical tool rather than just an accounting statistic.
What Is EPS?
Earnings per share measures a company’s earnings on a per-share basis.
Consider two hypothetical companies:
| Company A | Company B | |
|---|---|---|
| Earnings available to common shareholders | $100 million | $100 million |
| Weighted-average shares | 50 million | 100 million |
| EPS | $2.00 | $1.00 |
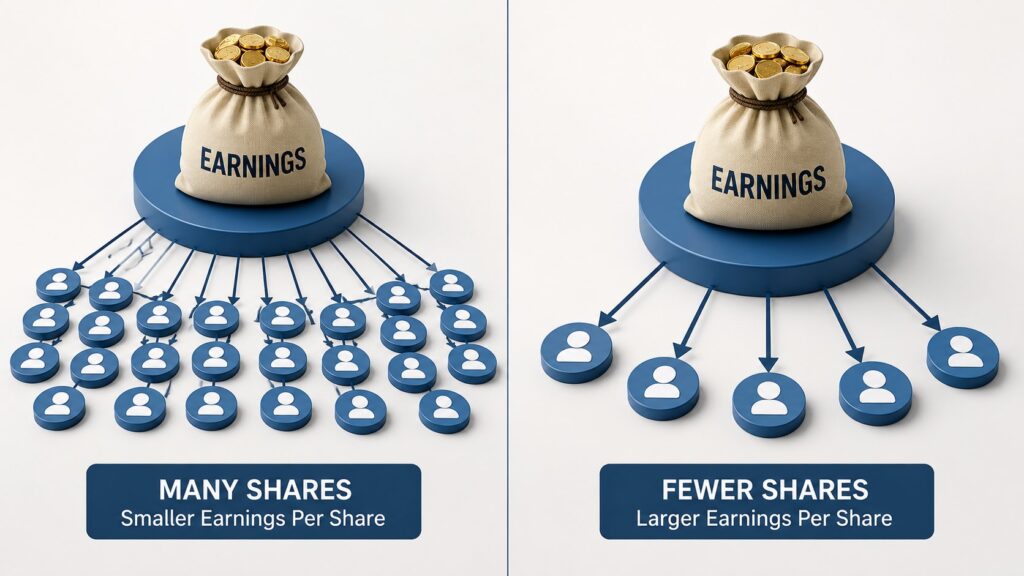
Both companies earned the same $100 million.
Yet Company A produced twice as much earnings per share because its earnings were spread across fewer shares.
This distinction matters because a shareholder owns only a fraction of the company. EPS translates total earnings into a per-share figure that can be compared across time and used in valuation.
EPS Explained With a Simple Calculation
Suppose a hypothetical company reports:
- $500 million in earnings available to common shareholders
- 100 million weighted-average common shares outstanding
Its EPS would be:
$500 million ÷ 100 million shares = $5.00 per share
Now assume earnings increase to $600 million while the share count remains unchanged.
$600 million ÷ 100 million shares = $6.00 per share
EPS increased 20%, and in this case the improvement came from higher earnings.
Now change only the share count.
Suppose earnings remain at $500 million while weighted-average shares fall from 100 million to 90 million.
$500 million ÷ 90 million shares = approximately $5.56 per share
EPS increased about 11% even though total earnings did not grow.
This is one of the most important ideas for beginners:
EPS growth and business growth are not always the same thing.
A useful first check is whether net income rose along with EPS. If it did not, the share count may explain much of the change.
Why EPS Matters to Investors
In practical terms, EPS Explained means looking beyond the earnings number and connecting it with shareholder dilution, growth, and valuation.
It Shows Profit on a Per-Share Basis
Net income tells you how much profit a company generated.
EPS adjusts that profit for the number of shares participating in it.
If net income grows 10% while the weighted-average share count also rises 10%, shareholders may see little or no EPS growth.
The reverse is also possible. If profits grow while the share count declines, EPS may increase faster than total earnings.
That makes EPS useful because it focuses on the economics attributable to each share rather than only the size of the company.
EPS Is a Building Block of the P/E Ratio
One reason EPS Explained deserves attention is its direct connection to valuation.
The price-to-earnings ratio is commonly calculated as:
P/E Ratio = Share Price ÷ Earnings Per Share
Investor.gov explains the P/E ratio as a way of comparing a stock’s price with its earnings per share.
Suppose a stock trades at $60 and trailing EPS is $3.
$60 ÷ $3 = P/E of 20
If EPS later rises to $4 while the share price stays at $60:
$60 ÷ $4 = P/E of 15
The valuation multiple fell even though the stock price did not move.
This is why investors should understand the earnings figure underneath the P/E ratio. If EPS is unusually high, temporary, or deteriorating, the P/E ratio can give an incomplete impression.
EPS Growth Can Reveal Per-Share Progress
Investors often compare EPS over several years.
| Year | EPS | Growth |
| Year 1 | $2.00 | — |
| Year 2 | $2.30 | 15.0% |
| Year 3 | $2.60 | 13.0% |
| Year 4 | $3.00 | 15.4% |
This pattern may indicate consistent growth in earnings attributable to each share.
But the more useful question is:
What is driving that growth?
Revenue growth, higher margins, lower interest expense, tax changes, acquisitions, asset sales, and share repurchases can all affect EPS.
The direction matters. The source matters more.
Basic EPS vs. Diluted EPS
Company filings commonly report two EPS figures:
Basic EPS and diluted EPS.
Basic EPS generally uses the weighted-average number of common shares outstanding during the period.
Diluted EPS considers the potential effect of securities that could increase the effective share count when they are dilutive, such as stock-based awards or convertible securities.
Consider a simplified hypothetical example:
| Basic | Diluted | |
| Earnings | $200 million | $200 million |
| Weighted-average shares | 100 million | 105 million |
| EPS | $2.00 | $1.90 |
The diluted figure is lower because the same earnings are effectively spread across more shares.
For beginners learning EPS Explained, diluted EPS deserves particular attention because it gives a broader view of potential dilution than basic EPS alone.
A gap between the two figures does not automatically mean something is wrong. It simply tells investors that potential share issuance may affect per-share economics.
Why the Weighted-Average Share Count Matters
EPS normally uses a weighted-average share count, not simply the number of shares outstanding at the end of the reporting period.
Suppose a company had:
- 100 million shares for the first half of the year
- 120 million shares for the second half
A simplified weighted-average calculation would be:
(100 million × 0.5) + (120 million × 0.5) = 110 million shares
Using 120 million shares for the entire year would ignore the fact that those additional shares were not outstanding during the first six months.
This detail becomes especially relevant after a large stock issuance or share repurchase.
How Share Buybacks Can Increase EPS
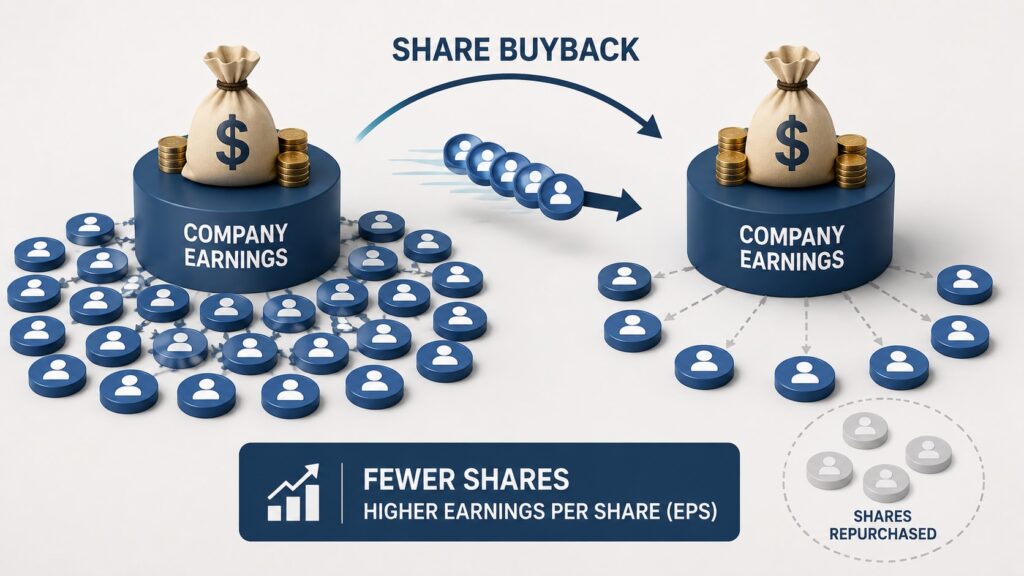
A company can increase EPS by reducing its share count even when total earnings do not change.
For example, if $1 billion of earnings are spread across 200 million shares, EPS is $5.00. If the share count falls to 180 million while earnings stay the same, EPS rises to about $5.56.
The calculation itself is straightforward. The harder question is whether the buyback created value.
A more useful buyback analysis asks:
- Did the company repurchase shares at a reasonable valuation?
- Did it borrow heavily to finance the buyback?
- Did the share count actually decline?
- Or did the repurchases mainly offset stock-based compensation?
That distinction matters.
A company can spend billions on buybacks while barely reducing its diluted share count if it is also issuing substantial employee equity.
When EPS growth coincides with major repurchases, compare net income, diluted EPS, and diluted weighted-average shares. Together, those figures show whether growth came mainly from better business performance, a smaller share base, or both.
How Share Issuance Can Reduce EPS
The reverse can happen when a company issues additional shares.
Suppose net income rises from $100 million to $110 million, but weighted-average shares increase from 50 million to 60 million.
EPS falls from:
$2.00 to approximately $1.83
So a company can generate more total profit while producing less earnings per share.
That is dilution.
Dilution is not automatically bad. Companies may issue shares to fund acquisitions, strengthen the balance sheet, compensate employees, finance expansion, or avoid excessive debt.
The relevant question is whether the capital raised ultimately creates enough value to justify the larger share count.
Why a Higher EPS Does Not Automatically Mean a Better Stock
This is where EPS Explained becomes more than learning a formula.
A company earning $10 per share is not automatically a better investment than one earning $2 per share.
Suppose:
- Company A earns $10 per share and trades at $300.
- Company B earns $2 per share and trades at $20.
Their P/E ratios are:
- Company A: 30
- Company B: 10
Even that comparison does not tell you which stock is more attractive.
Company A may have stronger growth, higher margins, a more durable competitive position, or lower financial risk. Company B may look cheap because investors expect future earnings to fall.
EPS is an input into analysis, not a standalone buy or sell signal.
Reported EPS vs. Adjusted EPS
Earnings releases frequently include both GAAP EPS and adjusted, or non-GAAP, EPS.
GAAP EPS is based on earnings reported under generally accepted accounting principles.
Adjusted EPS removes certain items that management believes do not reflect ongoing operating performance.
This is another reason EPS Explained should go beyond the headline number: two companies can report similar adjusted EPS while having very different GAAP earnings and adjustment policies.
Common adjustments may include restructuring costs, acquisition-related expenses, impairment charges, or other unusual items.
Adjusted figures can provide useful context, especially when a genuinely unusual event distorts one reporting period.
But the adjustment itself still requires judgment.
If a company excludes a restructuring charge once during a major reorganization, the adjustment may be reasonable for comparison purposes.
If similar “one-time” charges appear every year, investors should ask whether they are really unusual.
A practical sequence is:
GAAP EPS → Identify adjustments → Understand why they were removed → Compare with adjusted EPS
Beginner Check: If GAAP EPS and adjusted EPS are far apart, read the reconciliation and check whether the excluded expenses are genuinely unusual. Repeated “one-time” charges deserve closer examination.

Adjusted EPS should not automatically be treated as the better number simply because it is higher.
The useful information often comes from understanding why the two figures differ.
Where Can You Find a Company’s EPS?
For U.S. public companies, EPS can usually be found in:
- Form 10-K annual reports
- Form 10-Q quarterly reports
Investor.gov’s guide to Form 10-K and Form 10-Q explains how these filings provide investors with company financial information.
The filings usually allow investors to inspect:
- Basic EPS
- Diluted EPS
- Net income
- Weighted-average shares
- Potentially dilutive securities
- Explanations of major earnings changes
The SEC’s EDGAR filing system provides free public access to company reports.
A beginner does not need to read an entire filing from front to back.
Start with the income statement and the EPS footnote. If the number changed sharply, look for the explanation.
Four Questions to Ask When EPS Changes
A practical EPS Explained framework starts by asking four questions instead of reacting immediately to a headline such as “EPS up 20%.”
1. Did total earnings change?
Compare EPS growth with net income or earnings attributable to common shareholders.
If EPS rose much faster than earnings, a shrinking share count may be contributing.
2. Did the diluted share count change?
A falling share count can boost EPS.
A rising share count can hold EPS growth back.
The direction alone is not enough. Investors need to understand why the share count changed.
3. Was the change driven by normal operations?
Look for unusual gains, restructuring charges, asset sales, tax effects, impairments, or acquisition-related expenses.
A large one-time item can make one quarter look unusually strong or weak.
4. Does EPS agree with the rest of the business?
Compare EPS with revenue, margins, cash flow, debt, and management’s explanation.
If EPS is rising while several other business indicators are weakening, the difference deserves more investigation.
This framework will not predict the stock price.
It does something more useful: it helps explain what the EPS number actually represents.
Common Beginner Mistakes With EPS
Treating EPS Like a Stock Price
EPS is not the amount a stock “should” be worth.
A company earning $5 per share could trade at very different prices depending on growth expectations, risk, interest rates, industry economics, and valuation.
Looking at One Quarter in Isolation
Quarterly EPS can move sharply because of seasonality or unusual items.
A multi-quarter or multi-year trend usually provides more context.
The better question is not simply whether EPS rose, but whether the drivers of that growth appear repeatable.
Ignoring Dilution
Strong total earnings growth can look less impressive if a company is also issuing large amounts of stock.
Compare net income growth with diluted EPS growth and the diluted share count.
Assuming EPS Growth Means Revenue Growth
EPS can increase even when revenue does not.
Margins may improve, interest expense may decline, taxes may change, or the company may repurchase shares.
That is why EPS should be traced back through the financial statements.
Automatically Preferring Adjusted EPS
Adjusted EPS often looks higher than GAAP EPS because certain expenses have been excluded.
That does not make adjusted EPS wrong, but it does mean investors should understand the reconciliation before relying on it.
What Should You Check Alongside EPS?
EPS becomes more useful when it is compared with the rest of the business.
| Metric | What to Check |
| Revenue | Is the business actually growing, or is EPS rising mainly because of cost cuts or buybacks? |
| Operating Margin | Is the company producing more operating profit from each dollar of sales? |
| Free Cash Flow | Are reported earnings supported by cash generation? |
| Diluted Share Count | Are buybacks reducing shares, or is stock issuance creating dilution? |
| Debt | Is earnings growth being accompanied by greater financial risk? |
| Valuation | How much are investors paying for the company’s current and expected earnings? |
These metrics do not replace EPS. They explain it.
For a broader understanding of where earnings come from, see How to Read Financial Statements: A Simple and Powerful Beginner’s Guide.
For valuation, Is a Low P/E Ratio Always Better? 5 Costly Mistakes to Avoid is a natural next step because EPS sits directly underneath the P/E ratio.
Readers who want a wider framework can also continue with Fundamental Analysis for Beginner Investors: A Smart Guide to Better Stock Decisions.
Final Takeaway: EPS Is the Beginning of the Analysis
EPS Explained correctly is not simply “profit divided by shares.”
It connects two questions:
How much profit is the company generating?
And how many shares participate in those earnings?
That is why rising EPS should lead to another question:
What caused it to rise?
If earnings, margins, and cash flow are improving while the share count remains sensible, EPS growth may reflect stronger per-share economics.
If EPS growth comes mainly from repeated adjustments, aggressive buybacks, or other factors while the underlying business stagnates, the interpretation changes.
Use EPS as a starting point. Then trace it back to earnings, dilution, cash flow, and valuation before deciding what the number really tells you.
FAQ
Q1. What does EPS mean in stocks?
EPS stands for earnings per share. It measures a company’s earnings attributable to common shareholders on a per-share basis using the relevant weighted-average share count.
Q2. Is a higher EPS always better?
No. Higher EPS can be encouraging, but the number alone does not tell you whether the business is improving or whether the stock is attractively valued. Investors should examine what caused the change.
Q3. What is the difference between basic EPS and diluted EPS?
Basic EPS uses the basic weighted-average common share count. Diluted EPS includes the potential effect of certain securities that could increase the effective share count when they are dilutive.
Q4. Can a company increase EPS without increasing earnings?
Yes. If a company reduces its share count through stock repurchases while earnings remain unchanged, EPS can rise because the same earnings are divided among fewer shares.
Q5. Why does EPS matter for the P/E ratio?
The P/E ratio divides a stock’s price by earnings per share. Understanding EPS in context helps investors judge whether the earnings figure underneath that valuation multiple is representative and sustainable.
📚 Related Articles
How to Read Financial Statements: A Simple and Powerful Beginner’s Guide
Is a Low P/E Ratio Always Better? 5 Costly Mistakes to Avoid
Fundamental Analysis for Beginner Investors: A Smart Guide to Better Stock Decisions

Stock Valuation Checklist: 7 Critical Checks Before Calling a Stock Cheap
A stock can look cheap because its price has fallen 40%, its P/E ratio is…

RSI Divergence vs MACD Crossover: Which Is More Reliable for Trading?
RSI divergence can warn that price momentum is weakening before a reversal becomes obvious. A…

Before You Buy the Dip: 5 Critical Balance Sheet Checks Every Investor Should Make
A stock that falls 20%, 30%, or even 50% can suddenly look cheap. But a…
Disclaimer: This article is for educational purposes only. It is not financial advice or a recommendation to buy or sell any specific stock, ETF, cryptocurrency, or other asset. All investment decisions are your own responsibility.