
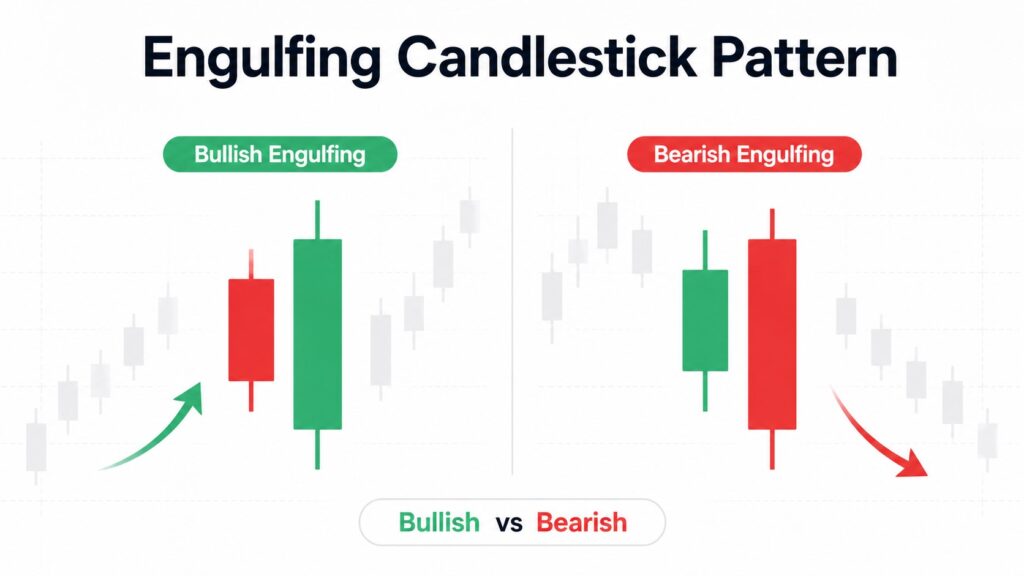
A large candle suddenly appears and completely covers the candle before it. For many beginner traders, this looks like an obvious reversal signal.
But is one large candle really enough to show that the market is changing direction?
The Engulfing Candlestick Pattern is easy to recognize, which makes it popular among new stock and crypto traders. However, the pattern becomes useful only when it appears in the right place and is supported by other evidence.
A bullish or bearish engulfing candle may show that control is shifting between buyers and sellers. It does not guarantee that a reversal will follow.
This guide explains how the pattern works, how bullish and bearish engulfing setups differ, what confirmation means, and how beginners can review the pattern without reacting to every large candle they see.
Key Takeaways
- An engulfing pattern is made of two candles.
- The second candle’s real body covers the first candle’s real body.
- A bullish engulfing pattern may suggest that buyers are gaining control.
- A bearish engulfing pattern may suggest that sellers are gaining control.
- Trend, location, volume, and confirmation matter more than the candle shape alone.
What Is an Engulfing Candlestick Pattern?
An Engulfing Candlestick Pattern is a two-candle pattern that may signal a change in short-term price direction.
To understand it, beginners should first separate the candle body from the candle wick.
The real body is the thick section between the opening and closing prices. The thin lines above and below the body are called wicks. They show the highest and lowest prices reached during that period.
In a valid engulfing pattern, the second candle’s real body fully covers the first candle’s real body.
The wicks do not always need to be completely covered.
For example, if the first candle opens at $100 and closes at $102, the second candle must have a body that extends below $100 and above $102 for it to engulf the first body.
The pattern is usually more meaningful after a clear rise or decline. In the middle of a random sideways range, the same candle shape may simply reflect short-term price noise.
For readers who want to compare this definition with a visual chart example, TradingView provides a useful explanation of the bullish engulfing pattern.
Bullish Engulfing Pattern
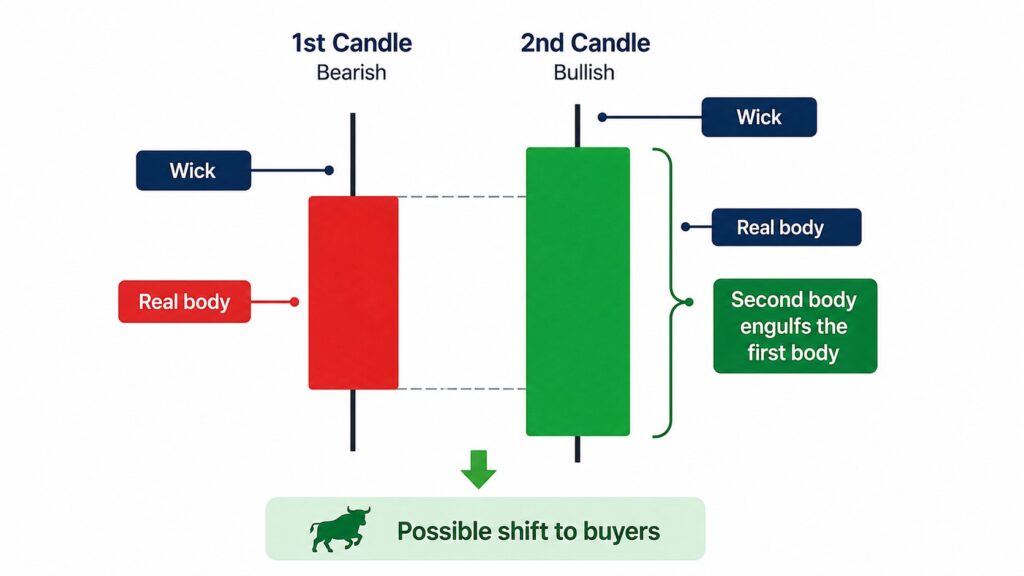
The bullish version of the Engulfing Candlestick Pattern usually appears after a clear decline or a temporary pullback.
Its basic structure is:
- Price has been falling.
- The first candle is bearish and relatively small.
- The second candle is bullish and larger.
- The second candle’s body fully covers the first candle’s body.
A bearish candle closes below its opening price. A bullish candle closes above its opening price.
Bullish Market Psychology
Before the pattern appears, sellers have been controlling the market.
The second candle may begin with continued weakness, but buyers then step in and push the price upward. By the close, the bullish candle has covered the entire body of the previous bearish candle.
This suggests that buyers were strong enough to reverse the previous session’s selling pressure.
Simple interpretation: Sellers started in control, but buyers finished the session with greater strength.
That does not prove that the downtrend is over. It only shows that the balance between buyers and sellers may be changing.
Simple Bullish Example
Imagine a stock opens at $102 and closes at $100, creating a small bearish candle.
The next session opens at $99.50. Buyers then enter the market and push the price to $103 before the close.
The second candle’s body stretches from $99.50 to $103, fully covering the first candle’s body from $100 to $102.
This creates a bullish engulfing pattern.
The setup becomes more meaningful if it forms near a previous support area, where buyers have reacted before, and if trading volume also increases.
Bearish Engulfing Pattern
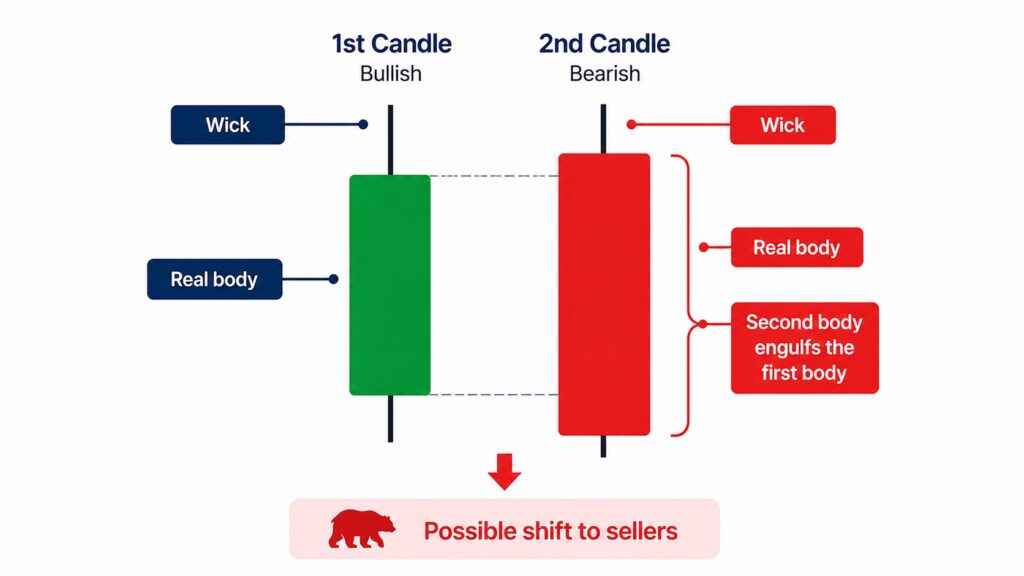
The bearish version of the Engulfing Candlestick Pattern usually appears after a clear advance or an extended rally.
Its structure is the opposite:
- Price has been rising.
- The first candle is bullish and relatively small.
- The second candle is bearish and larger.
- The bearish candle’s body fully covers the previous bullish body.
Bearish Market Psychology
Before the pattern appears, buyers have been controlling the market.
The second candle may open with continued strength, but sellers then enter aggressively. By the close, the bearish candle has erased the previous candle’s body and pushed the price lower.
Simple interpretation: Buyers started with control, but sellers became stronger before the session ended.
This can be an early warning that upward momentum is weakening. It is not proof that a full downtrend has started.
Simple Bearish Example
Suppose a cryptocurrency opens at $60,000 and closes at $61,000, creating a small bullish candle.
The next candle opens at $61,300 but later falls and closes at $59,400.
The bearish candle’s body covers the full range of the previous bullish body, creating a bearish engulfing pattern.
The signal may carry more weight if it forms near resistance, after a strong rally, or after price fails to hold above a breakout level.
Bullish vs Bearish Engulfing
| Feature | Bullish Engulfing | Bearish Engulfing |
|---|---|---|
| Previous trend | Decline or pullback | Advance or rally |
| First candle | Small bearish candle | Small bullish candle |
| Second candle | Larger bullish candle | Larger bearish candle |
| Possible message | Buyers may be gaining control | Sellers may be gaining control |
| Best location | Near support or a swing low | Near resistance or a swing high |
| Confirmation to watch | Higher close or break above the pattern high | Lower close or break below the pattern low |
The pattern direction matters, but the previous trend matters just as much.
A bullish engulfing candle after a strong rally is not the same as a bullish engulfing candle after a clear decline. Without the proper previous move, the pattern may not represent a true reversal setup.
Engulfing Pattern vs Harami Pattern
Beginners often confuse engulfing and harami patterns because both use two candles.
The easiest way to separate them is to compare the size of the second candle.
| Feature | Engulfing Pattern | Harami Pattern |
| Second candle | Larger than the first | Smaller than the first |
| Body position | Covers the first candle’s body | Stays inside the first candle’s body |
| Main message | Possible shift in control | Slowing momentum or indecision |
With an engulfing pattern, the second candle takes over the first candle’s body.
With a harami pattern, the second candle stays inside the first. This usually suggests hesitation rather than a decisive change in control.
An engulfing pattern may look stronger visually, but neither pattern should be used without context.
Why Location Matters
The same candle shape can have different meanings depending on where it appears.
The Engulfing Candlestick Pattern becomes more useful when its location supports the reversal message shown by the candles.
This is one of the most important lessons for beginners.
An engulfing candle may be more useful when it forms near:
- Major support
- Major resistance
- A previous swing high or swing low
- A widely watched moving average
- A breakout or failed-breakout area
- An oversold or overbought zone
Support is an area where buyers previously stepped in.
Resistance is an area where sellers previously appeared.
A swing high is a recent visible price peak, while a swing low is a recent visible bottom.
Consider two bullish engulfing patterns.
The first forms near a well-established support level after several days of selling. The second forms in the middle of a narrow sideways range.
Even if the second pattern looks more perfect, the first may be more meaningful because it appears at an important price level.
When I scan charts, I often ignore engulfing candles that form in the middle of a narrow range, even when the shape looks clean. Without a useful price level nearby, the pattern often lacks a strong reason to matter.
A simple rule to remember is:
Location before formation.
The place where the pattern appears often matters more than how visually perfect the candle looks.
How to Confirm an Engulfing Pattern
Confirmation means looking for additional evidence that the price move may continue.
A beginner should not treat every engulfing candle as an automatic buy or sell signal.
Useful confirmation may include:
- The next candle closes in the expected direction.
- Volume increases during the engulfing candle.
- The pattern forms near support or resistance.
- Price breaks a recent swing high or swing low.
- RSI shows an oversold, overbought, or divergence condition.
- The broader market trend supports the setup.
For a bullish pattern, some traders wait for price to close above the engulfing candle’s high.
For a bearish pattern, they may wait for price to close below the engulfing candle’s low.
In practice, I prefer to see at least two supporting clues, such as a strong support level and increasing volume, rather than relying on the candle alone.
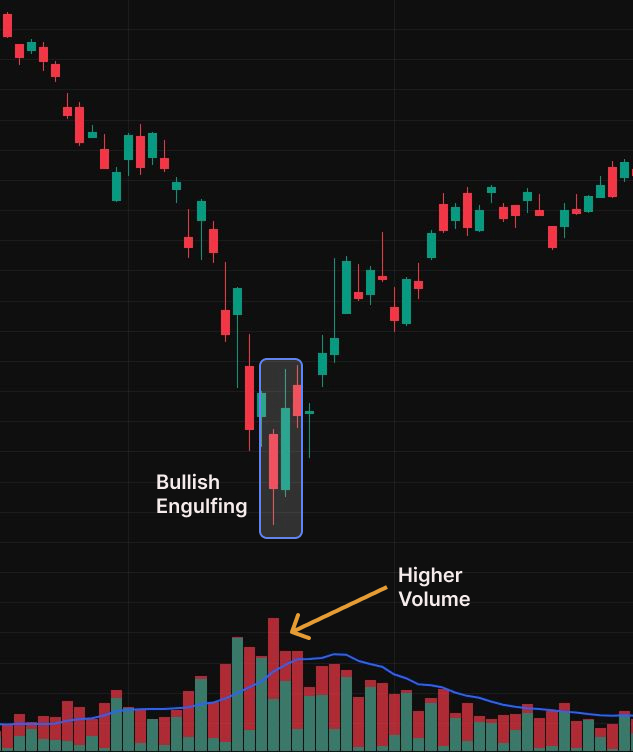
Waiting for confirmation can reduce early entries, although it may also mean entering at a less favorable price. This is a trade-off rather than a perfect solution.
Engulfing patterns are usually more useful when combined with other forms of analysis. Fidelity’s technical analysis guide also explains that technical indicators are generally considered alongside other technical or fundamental information.
A Simple Engulfing Candlestick Strategy
The following is a beginner-friendly analysis routine, not a guaranteed trading system.
Bullish Setup
- Identify a clear decline or pullback.
- Mark a nearby support area.
- Check whether a bullish engulfing pattern forms near that level.
- Confirm that the second candle’s body fully covers the first body.
- Look for stronger volume or a confirming next candle.
- Decide where the setup becomes invalid.
- Compare the possible target with the amount of risk.
A possible target might be the next resistance level.
The risk-to-reward ratio compares how much a trader may lose with how much they hope to gain. For example, risking $1 to aim for $2 would create a 1-to-2 risk-to-reward plan.
Bearish Setup
For a bearish setup, the process is reversed:
- Identify a clear advance.
- Mark a nearby resistance area.
- Look for a bearish engulfing pattern.
- Wait for downside confirmation.
- Decide where the setup becomes invalid.
- Use the next support area as a possible reference point.
The purpose of this routine is not to predict the market perfectly. It is to avoid making a decision from one candle alone.
Common Beginner Mistakes
Trading Every Large Candle
Not every large candle is an engulfing candle.
The second real body must fully cover the first real body. A candle that is simply larger is not enough.
Ignoring the Previous Trend
A bullish engulfing pattern normally matters after a decline. A bearish engulfing pattern normally matters after an advance.
Without a clear previous move, the reversal meaning becomes weaker.
Entering Before the Candle Closes
A candle can look like an engulfing pattern during the session and then change before the close.
Waiting until the candle is complete helps avoid reacting to a pattern that has not fully formed.
Ignoring Support and Resistance
An engulfing candle in the middle of a range may have little meaning.
The location should be checked before the candle shape.
Using a Stop That Is Too Wide
A large engulfing candle can create a very wide stop-loss area.
If the distance between the entry and the invalidation point is too large, the setup may not offer a reasonable risk-to-reward ratio.
Ignoring Volume and Market Conditions
A bullish engulfing pattern in one stock may fail if the broader market is falling sharply.
A bearish pattern may also fail during a strong market-wide rally.
Individual candles should be read together with broader price conditions.
Is the Engulfing Candlestick Pattern Reliable?
The Engulfing Candlestick Pattern can be useful, but its reliability depends on the market conditions surrounding it.
Its quality depends on:
- Market context
- Timeframe
- Previous trend
- Support and resistance
- Trading volume
- Confirmation
- Risk management
Higher-timeframe charts, such as daily and weekly charts, often contain less random noise than one-minute or five-minute charts.
However, higher-timeframe setups may also require wider stop-loss levels because the candles cover larger price ranges.
Shorter timeframes can produce more signals, but many of those signals may fail during choppy trading.
No timeframe removes risk.
The best way to view the pattern is as one piece of evidence within a larger analysis process.
Personal Analysis Perspective
When I review a chart, I rarely focus on the engulfing candle first.
Instead, I check the overall trend, nearby support or resistance, and trading volume before deciding whether the pattern deserves attention.
When I look at a daily SPY chart, I usually care more about the larger trend and nearby support. On a shorter Bitcoin chart, sudden changes in volume and market noise become more important.
The pattern may look the same, but the way I judge it changes with the timeframe.
A simple rule I use is location before formation. An imperfect pattern near an important level, supported by volume and a confirming close, is often more useful than a perfect-looking pattern with no clear context.
Engulfing Pattern Checklist
Before using an Engulfing Candlestick Pattern as part of your analysis, ask the following questions:
- Is there a clear previous trend?
- Does the second body fully cover the first body?
- Did the pattern form near support or resistance?
- Is trading volume increasing?
- Did the next candle provide confirmation?
- Does the broader trend support the setup?
- Is the stop-loss location reasonable?
- Is the risk-to-reward ratio acceptable?
If several answers are no, the pattern may not be worth acting on.
Practical Investor Takeaway
A beginner-friendly chart routine is simple.
Start with the daily or weekly chart. Identify the broader trend. Mark support and resistance. Then look at the engulfing candle, its volume, and the next candle.
This order helps prevent a common mistake: becoming excited by one dramatic candle before understanding the larger chart.
For example, a bullish engulfing pattern on SPY near an established support level may deserve attention during a market pullback. The same pattern in the middle of an unclear range may not offer much useful information.
The candle is the last part of the analysis, not the first.
FAQ
Q1. What does an engulfing candlestick mean?
It suggests a possible shift in short-term control between buyers and sellers. The second candle’s real body fully covers the previous candle’s body.
Q2. Is bullish engulfing a strong buy signal?
Not by itself. It becomes more meaningful when it forms after a decline, near support, and with confirmation from volume or the next candle.
Q3. Does the wick need to engulf the previous candle?
No. The real bodies are the main requirement. The wicks do not need to be completely covered.
Q4. What is the difference between engulfing and harami?
In an engulfing pattern, the second candle’s body covers the first candle’s body. In a harami pattern, the second candle is smaller and remains inside the first candle’s body.
Q5. Which timeframe is best for engulfing patterns?
Daily and weekly charts often provide clearer signals than very short-term charts, although no timeframe guarantees success.
Q6. Can an engulfing pattern fail?
Yes. It can fail in sideways markets, near weak price levels, or when the broader trend moves against the signal.
Q7. Should volume confirm an engulfing pattern?
Rising volume can strengthen the setup because it shows greater market participation. However, volume should be considered together with trend and location.
Final Thoughts
The Engulfing Candlestick Pattern can help beginners recognize a possible change in control between buyers and sellers.
A bullish engulfing pattern may show that buyers are becoming stronger after a decline. A bearish engulfing pattern may show that sellers are gaining strength after a rally.
Still, no candlestick pattern guarantees a reversal.
The strongest setups usually combine the candle with a clear previous trend, an important support or resistance level, useful volume information, and confirmation from later price action.
The best traders rarely rely on one candle alone.
Instead, they combine candlestick patterns with trend, support and resistance, volume, and confirmation before making a decision.
📚 Related Articles
Candlestick Charts for Beginners: Easy Guide to Reading Price Action
Support and Resistance in Stock Charts: A Beginner’s Guide to Better Buy and Sell Timing
Trading Volume for Beginners: How to Read It With Price Action
RSI Indicator Explained for Beginners: How to Read Momentum Without Overreacting

Stock Valuation Checklist: 7 Critical Checks Before Calling a Stock Cheap
A stock can look cheap because its price has fallen 40%, its P/E ratio is…
RSI Divergence vs MACD Crossover: Which Is More Reliable for Trading?
RSI divergence can warn that price momentum is weakening before a reversal becomes obvious. A…

Before You Buy the Dip: 5 Critical Balance Sheet Checks Every Investor Should Make
A stock that falls 20%, 30%, or even 50% can suddenly look cheap. But a…
Disclaimer: This article is for educational purposes only. It is not financial advice or a recommendation to buy or sell any specific stock, ETF, cryptocurrency, or other asset. All investment decisions are your own responsibility.