
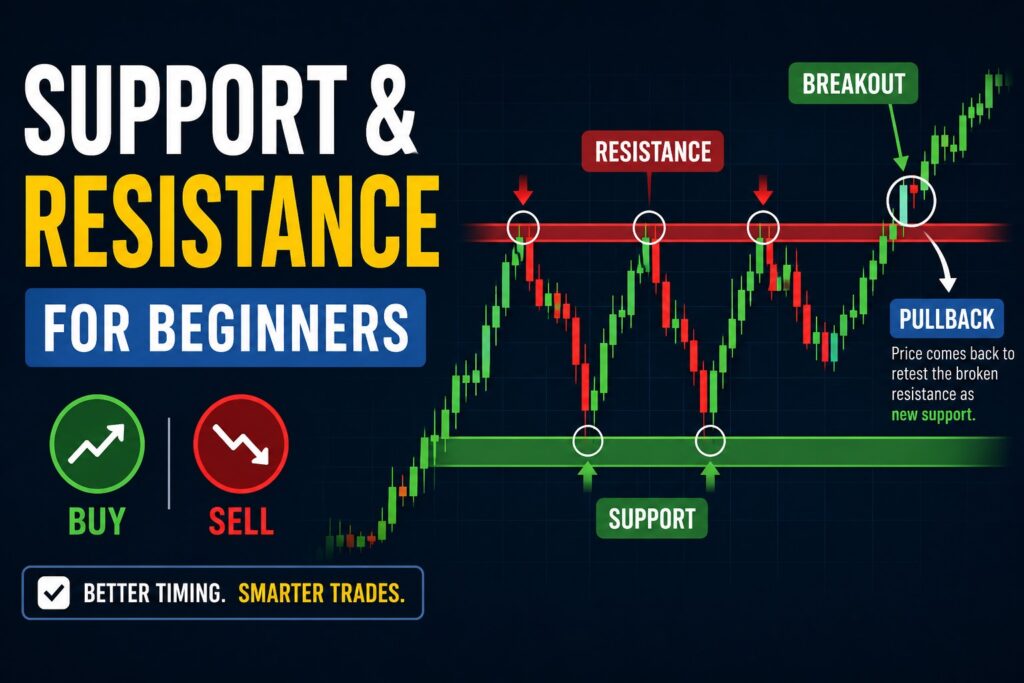
Support and Resistance in Stock Charts is one of the first concepts beginner investors should understand before thinking about buy and sell timing. Many beginner investors focus on finding the “perfect” stock but spend very little time learning how price actually moves on a chart.
One of the first concepts that helped me make more sense of stock charts was understanding support and resistance. These levels are not magic lines that predict the future. Instead, they show areas where buyers and sellers have reacted before.
When I look at a chart now, I usually start by identifying a few important support and resistance levels before thinking about anything else. It gives me a simple framework and helps me avoid making emotional decisions based on a single green or red candle.
For example, I no longer buy immediately just because a stock touches support. I first check whether volume, trend direction, and market conditions support the setup.
In this guide, you’ll learn what support and resistance mean, how breakouts and pullbacks work, and how beginners can think about buy and sell timing in a more structured way.
What Are Support and Resistance in Stock Charts?
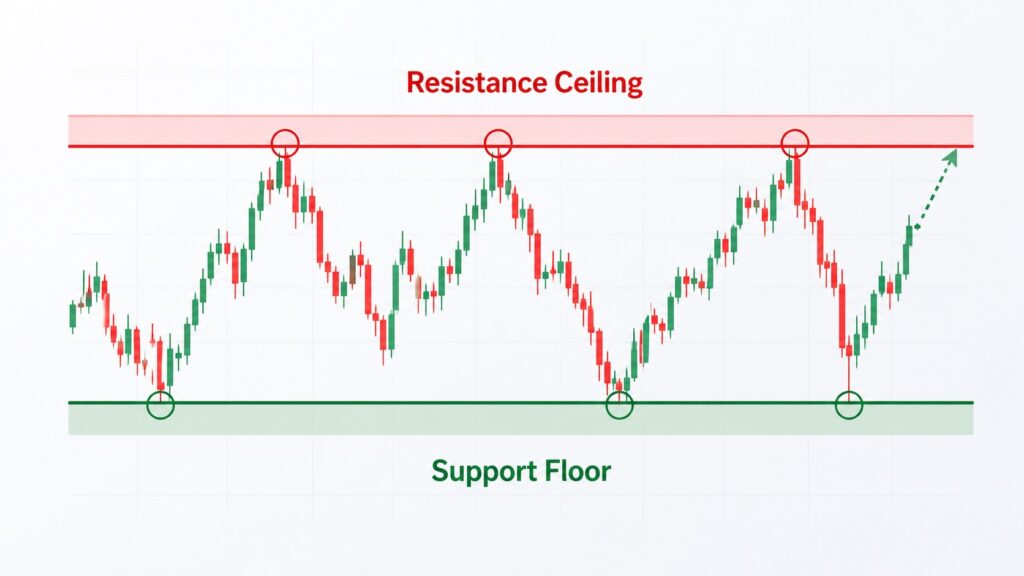
A simple way to think about it is that support and resistance are areas where price tends to pause, reverse, or react.
Support
Support is a price area where buying interest has previously appeared.
When a stock falls toward support, buyers may step in and slow down the decline. This does not guarantee that the stock will bounce, but it is a level worth watching.
Imagine a stock that has repeatedly stopped falling around the same area. That zone may become support because traders remember it as a place where demand appeared before.
Resistance
Resistance is the opposite. It is a price area where selling pressure has previously appeared.
When a stock rises toward resistance, some investors may take profits or sell positions, making it harder for the price to continue moving higher.
Think of resistance as a ceiling and support as a floor. The floor and ceiling can eventually break, but they often influence price behavior before that happens.
Why Support and Resistance in Stock Charts Matter
Support and resistance help investors understand market psychology. Charts are ultimately a visual record of buyer and seller decisions.
If many traders previously bought near a certain price, they may become interested again when the stock returns to that area. Likewise, investors who experienced losses near a resistance level may decide to sell when price revisits that zone.
This is why support and resistance often become self-reinforcing. The key point is not that these levels are always respected. The key is that they frequently attract attention from market participants.
For a broader definition of support and resistance, beginner investors can also review Investopedia’s explanation of support and resistance.
Understanding Breakouts
What Is a Breakout?
A breakout occurs when price moves above resistance or below support.
For example, imagine a stock has struggled to move above a certain level for several weeks. If buyers finally push through that area and price closes above resistance, traders call it a breakout.
Many investors monitor breakouts because they can signal a change in market sentiment. A strong breakout is often accompanied by increased trading volume, showing that more participants are supporting the move.
Beginner Example of Buy Timing
Suppose a stock trades in a range for several months. The stock repeatedly fails at resistance but eventually breaks above that level with strong volume.
A beginner investor might not buy immediately. Instead, they may wait to see whether the breakout holds for several days before making any decision.
This approach focuses on confirmation rather than excitement. Remember, this is not a recommendation to buy. It is simply an example of how investors often analyze chart behavior.
What Is a Pullback?
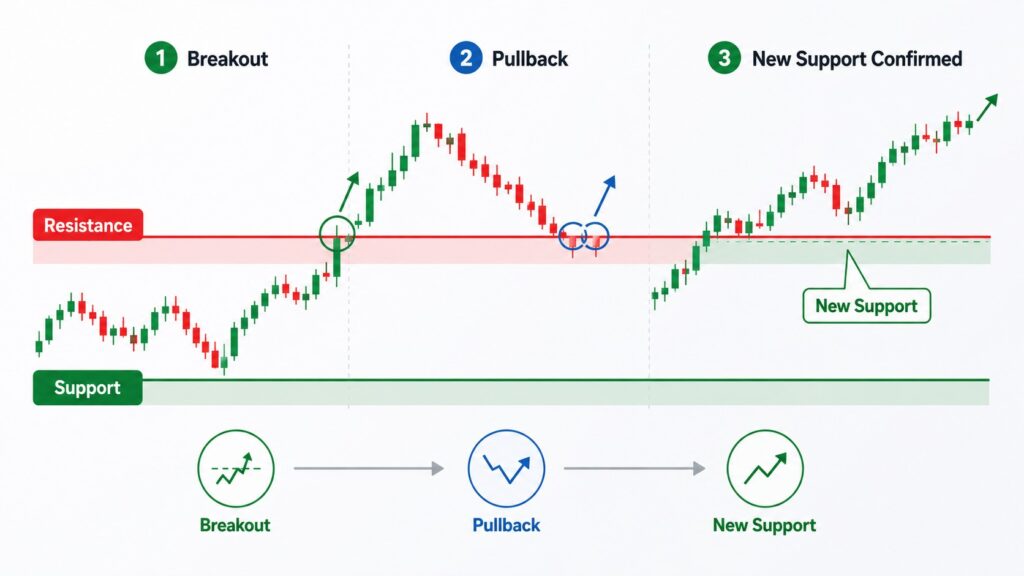
A pullback is a temporary move against the main trend.
After a breakout, prices do not usually move straight upward forever. Instead, they often return to test the previous resistance area. If that level begins acting as support, some traders view it as a healthy sign.
Beginner Example of Buy Timing
Imagine a stock breaks above resistance and then pulls back to that same level a week later.
Rather than chasing the stock at its highest point, some investors prefer watching how price behaves during the pullback. If buyers continue to defend the new support level, it may suggest that the breakout remains intact.
One mistake I made early was assuming every strong green candle meant I was already too late. In reality, many trends experience normal pullbacks before continuing higher.
What Is a False Breakout?
Not every breakout succeeds. A false breakout occurs when price briefly moves above resistance or below support but quickly reverses.
This is one reason technical analysis can be challenging for beginners. A stock may appear strong for a day or two before falling back into its previous trading range.
Example of Sell Timing
Suppose an investor owns a stock that repeatedly struggles near a major resistance level.
As price approaches resistance again, they may decide to reduce exposure or take partial profits rather than waiting for a breakout that never comes.
Another possibility is that a breakout initially succeeds but then fails and falls back below resistance. Many traders view this as a warning sign that buying momentum may be weakening.
Again, this is not financial advice. It is simply an example of how chart readers interpret price action.
A Simple Chart Reading Routine for Beginners
Support and resistance become much more useful when combined with a structured process.
I usually look at charts in this order:
- Start with the weekly or daily chart.
- Identify major support and resistance zones.
- Check the overall trend direction.
- Look for breakout or pullback behavior.
- Review trading volume.
- Consider broader market conditions.
- Avoid making decisions based on one candle or one indicator alone.
This routine helps reduce emotional reactions and encourages a more disciplined approach.
For example, if you are reviewing a stock such as SPY, QQQ, or NVDA, support and resistance levels may provide context for price movement, but they should never be used in isolation. Trend direction, volume, and overall market conditions matter as well.
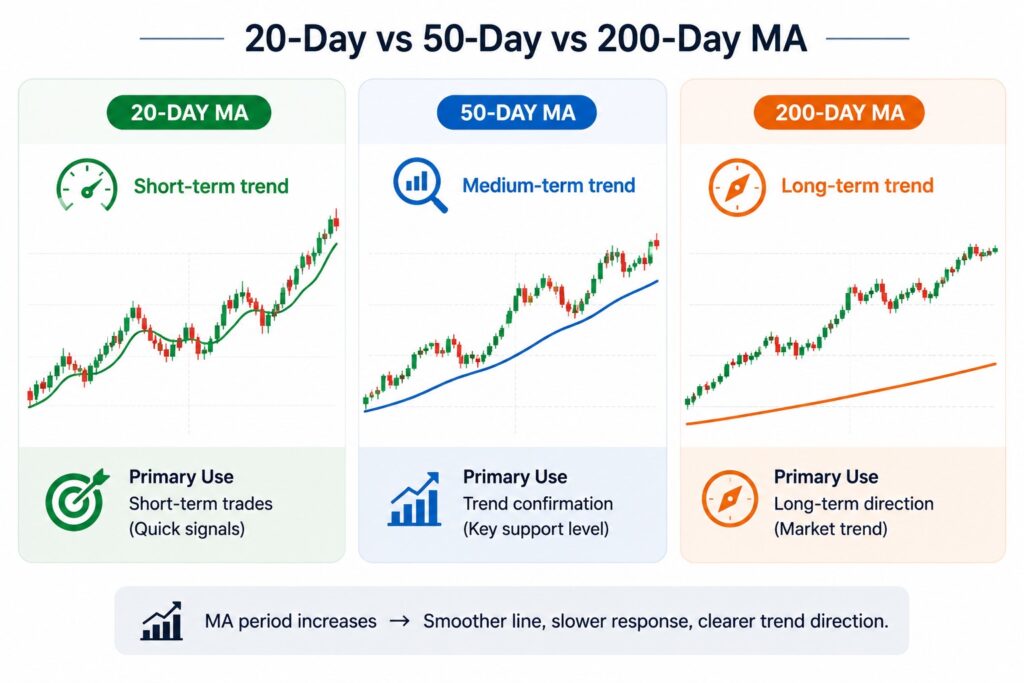
If you are still learning how to interpret price action, it may also help to understand Candlestick Charts for Beginners, How to Read Stock Volume in Technical Analysis, and Moving Average Explained for Beginners before relying heavily on support and resistance levels.
Investors who want to practice identifying support and resistance levels on real charts can also explore TradingView’s educational resources and charting tools.
Risk Management Matters More Than Perfect Timing
Many beginners spend all their time searching for the ideal entry point. In practice, risk management is often more important.
Use Stop-Loss Orders Carefully
A stop-loss is a predetermined price level where an investor exits a position to limit losses.
Not every investor uses stop-loss orders in the same way, but having a plan before entering a trade can help reduce emotional decision-making.
Manage Position Size
Avoid putting too much money into a single trade. Even the best-looking chart setup can fail.
Keeping position sizes reasonable can help protect your portfolio from unexpected market moves.
Avoid Emotional Trading
Fear and greed are powerful forces. A breakout can create excitement, while a sharp decline can create panic.
Many beginner mistakes happen when decisions are based on emotion instead of a clear plan.
A simple rule I like is to decide the maximum acceptable loss before entering any trade. It is much easier to follow a plan before emotions become involved.
The U.S. Securities and Exchange Commission (SEC) also provides investor education resources that can help beginners understand risk, diversification, and common investing mistakes.
Practical Investor Takeaway
Support and resistance are not prediction tools. They are reference points that help investors understand where buyers and sellers may become active.
A useful beginner framework is:
- Mark major support and resistance levels.
- Watch for breakouts and pullbacks.
- Look for volume confirmation.
- Be aware of false breakouts.
- Focus on risk management before focusing on profits.
This approach will not eliminate losses, but it can help create a more consistent decision-making process.
Final Thoughts
Learning support and resistance in stock charts is one of the simplest ways to begin understanding technical analysis. These levels help organize market information and provide context for price movements.
The mistake beginners often make is treating support and resistance as guaranteed turning points. Markets are never that predictable. Instead, think of them as areas of interest rather than exact prices.
Looking back, support and resistance became much more useful once I stopped treating them as exact buy and sell signals. Instead, I started viewing them as areas where I should pay closer attention to price behavior. That small shift helped me become more patient and less emotional when making investment decisions.
Over time, combining support and resistance with trend analysis, volume, and risk management can help you read charts with more confidence and less emotion.
This article is for educational purposes only and should not be considered investment advice.
❓ FAQ
Q1. Are support and resistance levels always accurate?
No. They are areas where price has reacted before, but they do not guarantee future results.
Q2. What is the difference between a breakout and a false breakout?
A breakout successfully moves through support or resistance and continues in that direction. A false breakout quickly reverses and returns to the previous range.
Q3. Should beginners buy every breakout?
Not necessarily. Many investors wait for confirmation, volume support, or a pullback before acting.
Q4. Why do support and resistance levels work?
They reflect the behavior and expectations of market participants, which can influence future buying and selling decisions.
Q5. What is the biggest beginner mistake?
Relying on one chart signal alone and ignoring risk management, trend direction, or overall market conditions.
📚 Related Articles
How to Read Stock Chart Trends: A Smart Beginner’s Guide
Moving Averages in Stocks: The Ultimate Guide to Clear Trend Reading
Trading Volume for Beginners: How to Read It With Price Action
Stop Loss and Take Profit Strategy for Beginners: How to Sell Stocks with Confidence

Stock Valuation Checklist: 7 Critical Checks Before Calling a Stock Cheap
A stock can look cheap because its price has fallen 40%, its P/E ratio is…
RSI Divergence vs MACD Crossover: Which Is More Reliable for Trading?
RSI divergence can warn that price momentum is weakening before a reversal becomes obvious. A…

Before You Buy the Dip: 5 Critical Balance Sheet Checks Every Investor Should Make
A stock that falls 20%, 30%, or even 50% can suddenly look cheap. But a…
Disclaimer: This article is for educational purposes only. It is not financial advice or a recommendation to buy or sell any specific stock, ETF, cryptocurrency, or other asset. All investment decisions are your own responsibility.
Pingback: How to Read Stock Chart Trends: A Smart Beginner’s Guide
Pingback: Stop Loss and Take Profit Strategy for Beginners
Pingback: Moving Averages in Stocks: The Ultimate Guide to Clear Trend Reading