
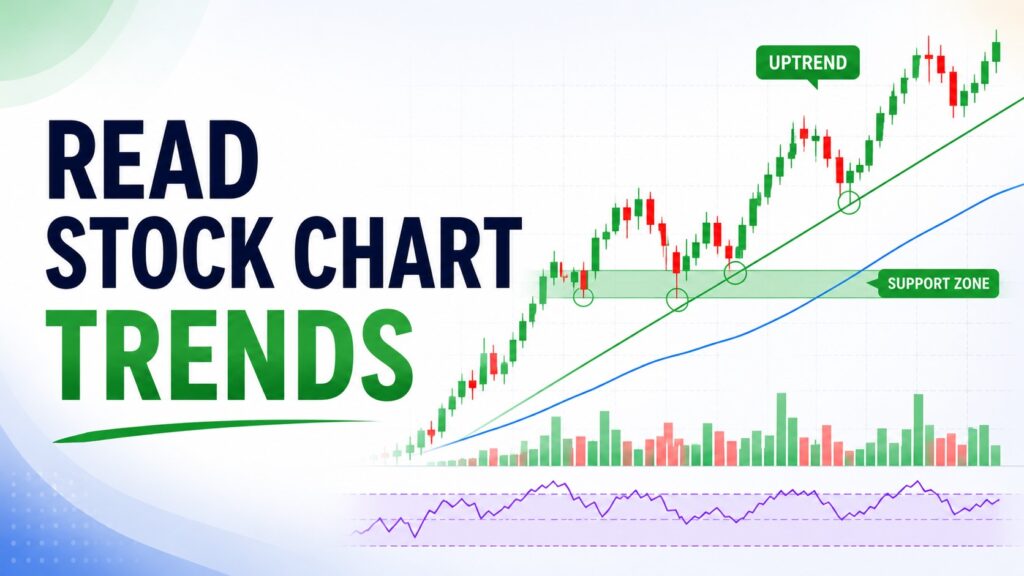
One of the most common mistakes beginners make is trying to predict the next candle instead of understanding the overall trend.
Instead of asking whether the next move will be up or down, start with a simpler question:
Who is currently in control — buyers or sellers?
Learning how to read stock chart trends helps answer that question. Before studying RSI, MACD, candlestick patterns, or more complicated trading strategies, it helps to first understand the market’s broader direction.
A chart is more than a collection of individual candles. Each candle shows a small part of the price action, while the trend provides the broader context.
That is why learning how to read stock chart trends should come before memorizing individual signals.
What Is a Stock Chart Trend?
A stock chart trend shows the general direction of price over time.
| Trend Type | What It Usually Shows |
|---|---|
| Uptrend | Buyers are generally in control |
| Downtrend | Sellers are generally in control |
| Sideways trend | Buyers and sellers are balanced |
A chart trend does not tell you where price will go tomorrow. It simply tells you which side currently has more control.
That distinction matters because beginners often treat every short-term move as a major signal. A stock can fall for several days and still remain in a healthy uptrend. It can also bounce sharply and still remain in a weak downtrend.
Same candle.
Different context.
This is why identifying the broader trend is more useful than reacting to a single candle.
Start With a Higher Time Frame
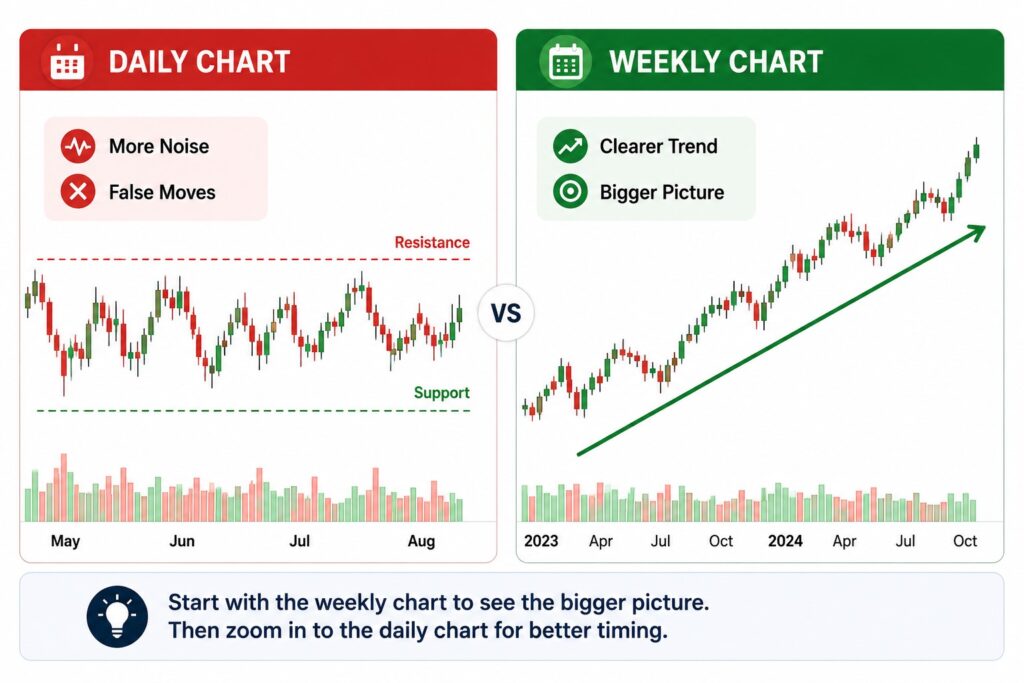
Starting with the weekly chart can help beginners avoid placing too much importance on individual daily candles. A sharp one-day decline can look alarming, while a strong one-day rebound can appear more meaningful than it really is.
Zooming out to a weekly chart often puts those short-term moves into better perspective.
The weekly chart helps filter out noise. For beginner investors, this can make it easier to avoid overreacting to short-term price swings. Weekly charts also make the broader trend easier to see. They help you see whether the stock is still moving in a larger uptrend, downtrend, or range.
A simple routine is:
- Check the weekly chart.
- Identify the larger trend.
- Move to the daily chart.
- Look for entry, risk, or confirmation details.
This order matters. If you start with the smallest time frame first, you may build your opinion around noise. If you start with the bigger trend first, the smaller details become easier to understand.
How to Identify an Uptrend
An uptrend usually has two basic features:
- Higher highs
- Higher lows
A higher high means price rises above a previous peak. A higher low means the next pullback does not fall below the previous low. Together, they show that buyers are willing to pay higher prices over time.
This does not mean price goes up every day. Even strong uptrends have corrections.
A useful example is QQQ during strong technology-led market periods. On the daily chart, short pullbacks can look uncomfortable. But on the weekly chart, price may still be respecting previous support zones or rising moving averages.
That is why beginners should avoid judging a trend from one candle.
The better question is:
Is the structure still making higher highs and higher lows?
If yes, the uptrend may still be intact.
How to Identify a Downtrend
A downtrend usually forms the opposite structure:
- Lower highs
- Lower lows
Lower highs show that buyers are failing to push price back to previous levels. Lower lows show that sellers continue to gain control.
Many beginners get trapped in downtrends because they focus only on how much a stock has already fallen. They think, “It is cheaper now, so it must be a good opportunity.”
But cheaper does not always mean safer.
A stock can fall sharply, bounce for a few days, and still remain in a downtrend if it keeps making lower highs. Large rebounds can happen inside weak trends, but a rebound is not the same as a confirmed reversal.
A downtrend deserves respect until the chart starts showing a different structure.
Sideways Trends Are Also Important
Not every market is trending. Sometimes price moves sideways for weeks or months. This happens when buyers and sellers are balanced.
Sideways markets often create frustration because breakouts can fail quickly. A stock may rise above resistance for a few days, attract buyers, and then fall back into the range. This is called a false breakout.
For beginners, sideways markets are a reminder that doing nothing can also be a decision. If the chart is unclear, forcing a trade or investment decision often creates unnecessary stress.
A useful question to ask is:
Is this stock trending, or is it trapped in a range?
Making that distinction before analyzing individual signals can reduce impulsive decisions based on short-term price movements.
Support and Resistance Should Be Zones, Not Thin Lines
Support and resistance are key parts of stock chart trend analysis. Support is an area where buyers have appeared before. Resistance is an area where sellers have appeared before.
The important word is area.
Beginners often draw support and resistance as thin exact lines. Then they get frustrated when price moves slightly below support before bouncing. Markets rarely respect perfect lines.
Treating support and resistance as zones rather than exact prices is often more practical because market participants do not all buy or sell at precisely the same level.
A useful rule of thumb is:
The more times price reacts near a zone, the more attention that zone deserves.
But support is not a guarantee. If price breaks below support with strong selling volume, the trend may be changing.
Moving Averages Help You See the Trend More Clearly
Moving averages smooth out price movements. They are commonly used in technical analysis to identify trend direction and reduce short-term price noise.
If you’re new to moving averages, Investopedia provides a beginner-friendly explanation of how moving averages work and why investors use them to identify trends.
Common examples include:
- 20-day moving average
- 50-day moving average
- 200-day moving average
- 20-week moving average
For beginner investors, moving averages are useful because they help reduce chart noise. If price stays above rising moving averages, the trend is often healthier. If price stays below falling moving averages, the chart may be showing weakness.
However, moving averages should not be used alone.
A stock crossing above the 50-day moving average does not automatically mean it is a buy. A stock falling below the 50-day moving average does not automatically mean it is doomed.
The better approach is to ask:
- Is the moving average rising or falling?
- Is price above or below it?
- Is price also respecting support or resistance?
- Is volume confirming the move?
- What is the broader market doing?
This makes moving averages part of a full process, not a mechanical signal.
Volume Shows the Conviction Behind a Move
Price tells you what happened. Volume tells you how much participation supported the move.
Imagine a stock breaks above resistance. If the breakout happens with strong volume, it may suggest real demand. If the breakout happens on weak volume, the move may be less reliable.
A breakout above resistance can look convincing at first, but price alone does not show how much participation is behind the move. A breakout accompanied by stronger volume may provide more confirmation than one occurring on unusually weak volume.
A useful question is:
Did the breakout attract meaningful participation?
Volume cannot tell investors whether a breakout will succeed, but it can provide additional context about the strength behind the price move.
This is where many beginners get caught by fake breakouts. They see price move above resistance and immediately assume a new trend has started.
But if volume is weak and the broader market is unstable, the breakout may fail quickly.
If you want to go deeper, a separate guide on how to read trading volume can help you understand breakouts and false signals more clearly.
Why Broader Market Context Matters
This is where many beginner chart guides stop too early. They explain candles, moving averages, and support lines, but ignore the bigger market environment.
That is a problem.
Individual stocks do not move in isolation. A strong-looking growth stock can struggle if QQQ is under pressure. A breakout in a technology stock may fail if Treasury yields are rising quickly and investors are reducing risk exposure.
For additional macro context, investors can monitor the U.S. 10-year Treasury yield because changes in yields can influence valuations and risk appetite, particularly for growth stocks. You can monitor it directly through FRED, which publishes regularly updated Treasury yield data from official sources.
Before interpreting a breakout, consider checking:
- SPY or QQQ trend
- U.S. 10-year Treasury yield direction
- Market risk sentiment
- Sector strength
- Volume confirmation
For example, instead of assuming that a stock breakout is automatically strong, consider the broader context:
A large-cap growth stock may look stronger when it breaks out while QQQ is also firm and Treasury yields are stable.
That does not guarantee anything. It simply means the chart is moving with a more supportive backdrop.
A Practical Chart Reading Routine for Beginners
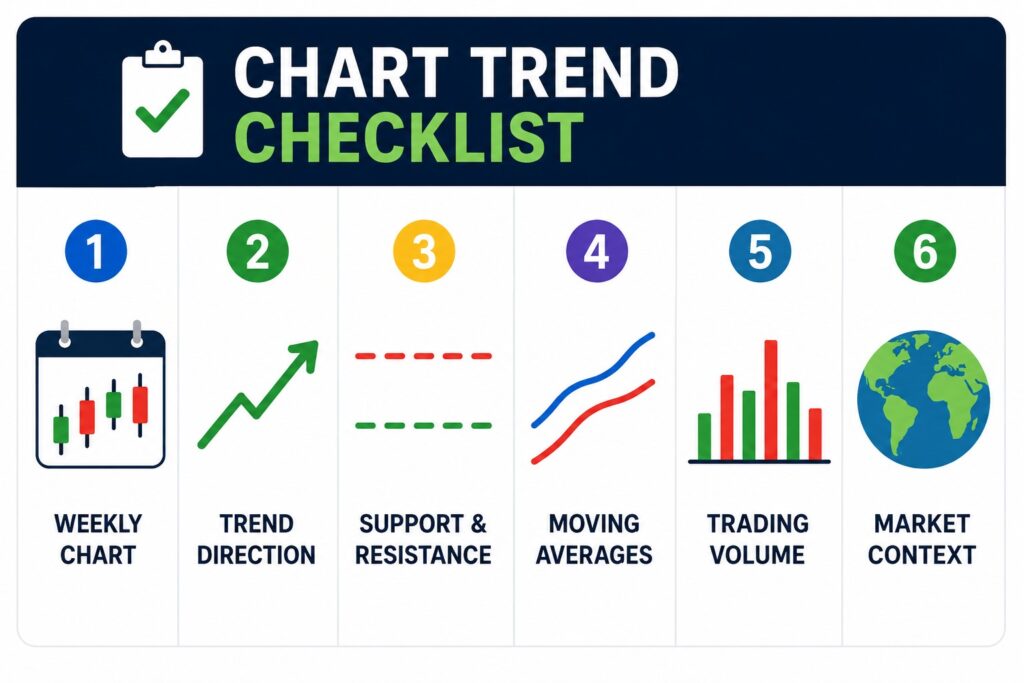
Here is a simple routine you can use before analyzing any stock or ETF.
The SEC Investor.gov website explains that technical analysis uses market activity such as price and volume, but it should be treated as a tool for analysis rather than a guarantee.
Step 1: Start With the Weekly Chart
The weekly chart helps reveal the broader trend and reduces the temptation to overreact to one dramatic daily candle.
Step 2: Identify the Market Structure
Look for higher highs, higher lows, lower highs, or lower lows. This tells you whether buyers or sellers are currently in control.
Step 3: Mark Support and Resistance Zones
Draw thick zones instead of thin lines. This reflects how real markets behave. Price often reacts around areas, not perfect numbers.
Step 4: Check Moving Averages
Look at whether major moving averages are rising, falling, or flattening. The slope often matters more than a single crossover.
Step 5: Study Volume
Ask whether recent breakouts or breakdowns happened with strong participation. Weak volume can make a move less convincing.
Step 6: Check the Broader Market
Look at SPY, QQQ, and Treasury yields. A stock chart is easier to trust when the broader environment supports the move.
Step 7: Avoid One-Signal Decisions
Do not make a decision from one candle, one indicator, or one headline. The best chart reading usually comes from combining several simple clues.
Common Beginner Mistakes When Reading Trends
Mistake 1: Starting With Too Small a Time Frame
A five-minute chart can make every move feel urgent. Beginners usually benefit from starting with daily and weekly charts first.
Mistake 2: Treating Support as a Guaranteed Bounce
Support is an area of interest, not a promise. If support breaks with heavy volume, the chart may be warning you.
Mistake 3: Buying Only Because a Stock Is Down
A falling stock is not automatically cheap. It may still be in a strong downtrend.
Mistake 4: Using Too Many Indicators
More indicators do not always create better analysis. They often create more confusion.
Mistake 5: Ignoring the Macro Environment
A good-looking chart can fail if the broader market is weak. This is especially important for growth stocks and high-beta sectors.
Practical Investor Takeaway
Learning how to read stock chart trends is not about finding a perfect signal. It is about building a repeatable process.
Start with the weekly chart. Identify the trend. Mark support and resistance zones. Check moving averages and volume. Then look at the broader market context.
A simple process like this can help beginner investors avoid emotional decisions. The goal is not to be right every time. The goal is to understand what the chart is actually saying before you act.
Final Thoughts
Learning how to read stock chart trends is less about predicting the next candle and more about understanding the structure behind the price movement.
No candle pattern, moving average, or technical indicator works in every market environment. Trends can weaken, break, or reverse, which is why chart signals should always be interpreted in context.
When the market feels confusing, zoom out first. A repeatable process cannot eliminate uncertainty, but it can help investors distinguish meaningful changes in trend from short-term market noise.
❓ FAQ
Q1. What is the easiest way to identify a stock trend?
The easiest way to learn how to read stock chart trends is to look for higher highs and higher lows in an uptrend, or lower highs and lower lows in a downtrend.
Q2. Are moving averages reliable for trend analysis?
Moving averages are useful, but they work best with support and resistance, volume, and market context.
Q3. Why does volume matter in trend analysis?
Volume shows whether a price move has strong participation behind it. A breakout with weak volume may be less reliable.
Q4. Can stock chart trends predict the future?
No. Trends do not predict the future. They help investors understand the current market environment and think in probabilities.
📚 Related Articles
Candlestick Charts for Beginners: Easy Guide to Reading Price Action
Moving Averages in Stocks: The Ultimate Guide to Clear Trend Reading
Trading Volume for Beginners: How to Read It With Price Action
Support and Resistance in Stock Charts: A Beginner’s Guide to Better Buy and Sell Timing

Capitalized vs. Expensed Costs: How Expense Timing Changes Reported Profits
A company spends $100 million developing technology. If the cost is expensed today, current profit…

High Interest Rates and the Economy: Why Can Growth Stay Strong?
If high interest rates are supposed to slow the economy, why can consumers keep spending,…

Can AI Become a Monopoly? Where the Real Economic Moats Are
Artificial intelligence appears to have many ingredients that could produce powerful monopolies. Training frontier models…
Disclaimer: This article is for educational purposes only. It is not financial advice or a recommendation to buy or sell any specific stock, ETF, cryptocurrency, or other asset. All investment decisions are your own responsibility.
Pingback: Support and Resistance in Stock Charts: A Beginner's Guide to Better Buy and Sell Timing
Pingback: Moving Averages in Stocks: The Ultimate Guide to Clear Trend Reading
Pingback: Trading Volume for Beginners: How to Read It With Price Action