
Trading volume for beginners is often explained too simply.
Many articles say, “High volume means strong interest,” and stop there. But when I first started reading stock charts, that kind of explanation did not help much. I still did not know whether high volume was bullish, bearish, or just noise.
Over time, I learned a simple way to think about it:
Price shows direction. Volume shows participation.
Volume becomes useful when you read it together with price action, trend, support and resistance, candlestick shape, moving averages, and broader market conditions.
A stock can rise on weak volume. It can fall on heavy volume. It can break above resistance and then fail quickly.
That is why volume does not predict the future by itself. It helps beginners judge how serious a price move may be at a specific chart location.
This article is for educational purposes only and is not a buy or sell recommendation.
What Trading Volume Means
Trading volume shows how many shares, contracts, or units were traded during a specific period.
On a daily stock chart, volume usually shows how many shares traded that day. On a weekly chart, it shows total volume for the week.
For Bitcoin or other crypto assets, volume may depend on the exchange or data provider. That is why beginners should avoid comparing volume numbers without context. The important question is not only “How big is the number?” but also “Is volume rising, falling, or suddenly spiking compared with recent activity?”
When I analyze charts, I rarely look at one volume bar alone.
I first ask:
Is price near support?
Is it testing resistance?
Is it pulling back to a moving average?
Is the broader market strong or weak?
Only after that does volume start to mean something.
For a basic definition of trading volume, beginners can also compare explanations from investor education sources such as Investopedia.
Why Volume Matters in Stock Trading
Volume matters because price movement without participation can be fragile.
A breakout above resistance may look exciting, but if volume is weak, the move may not have enough buyer interest behind it. A pullback may look scary, but if volume is drying up, it may simply be normal profit-taking instead of aggressive selling.
This is why trading volume for beginners should be used as a confirmation tool, not as a standalone signal.
For example, if QQQ breaks above a resistance area while volume expands and the broader Nasdaq trend is strong, that breakout may look more convincing.
But if QQQ breaks out while SPY is weak, Treasury yields are rising, and growth stocks are under pressure, the same signal becomes less reliable.
When I was a beginner, I made the mistake of buying breakouts simply because volume was high. Later, I realized that some of those moves were happening near major resistance after price had already become extended.
The volume was real.
The problem was the location.
That lesson changed how I read charts.
Instead of asking only, “Is volume high or low?” I now ask, “What is volume saying at this exact chart location?”
How Beginners Can Read Volume With Price Movement
Volume becomes easier to understand when you connect it with price action.
Instead of reading volume as a separate indicator, beginners should compare it with what price is doing, where price is located, and how the candle closes.
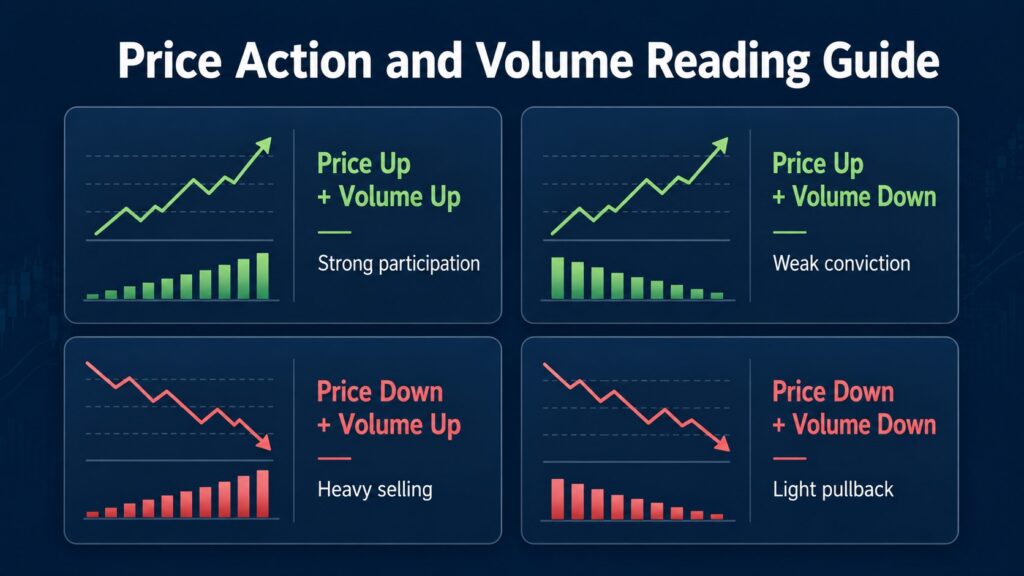
| Price Action | Volume Behavior | What It May Suggest |
|---|---|---|
| Price rises | Volume increases | Buying participation may be stronger |
| Price rises | Volume decreases | Rally may be losing energy |
| Price falls | Volume increases | Selling pressure may be rising |
| Price falls | Volume decreases | Pullback may be normal if trend is healthy |
| Price breaks resistance | Volume expands | Breakout may be more convincing |
| Price reaches support | Volume spikes | Buyers and sellers may be fighting |
| Price hits resistance | Volume spikes with upper wick | Sellers may be rejecting higher prices |
| Price pulls back to moving average | Volume dries up | Selling pressure may be cooling |
This table should not be used like a trading signal checklist.
The same volume spike can mean different things depending on whether price is breaking out, breaking down, or reacting near support or resistance.
Volume Increase During Breakouts
A breakout happens when price moves above a previous resistance area.
Beginners often get excited when they see price push above resistance. That is understandable because breakouts are visually powerful. But a breakout without volume can be weak.
When volume increases during a breakout, it may show that more buyers are participating. This does not guarantee continuation, but it can make the move more meaningful than a quiet breakout.
For example, if QQQ breaks above a resistance zone and volume expands compared with recent sessions, a beginner might treat that as a stronger sign of market participation. When checking examples like this, beginners can review historical price and volume data from Yahoo Finance before making any chart interpretation.
Still, the next step is important.
Did price close near the high?
Did it leave a long upper wick?
Are SPY and Nasdaq-related stocks also firm?
Is the breakout happening with the broader market, or is it happening alone?
A strong breakout usually looks better when price, volume, candle structure, and market environment are aligned.
Volume Drying Up During Pullbacks
Not every red candle is a warning sign.
This is something many beginners learn the hard way.
A stock or ETF can pull back after a strong rally simply because short-term traders are taking profits. In that situation, volume drying up can be useful information.
If price pulls back toward a rising moving average and volume becomes lighter, it may suggest that sellers are not pressing aggressively. The pullback may be a pause rather than a breakdown.
For example, SPY or QQQ may pull back after a rally. If the candles are controlled, the broader trend is still rising, and volume is lower than during the previous advance, the chart may be showing normal cooling rather than major distribution.
But low volume is not automatically bullish.
If price has already broken below major support, weak volume does not fix the chart. Volume drying up during a pullback is most useful when the larger trend, support area, and moving averages still support the structure.
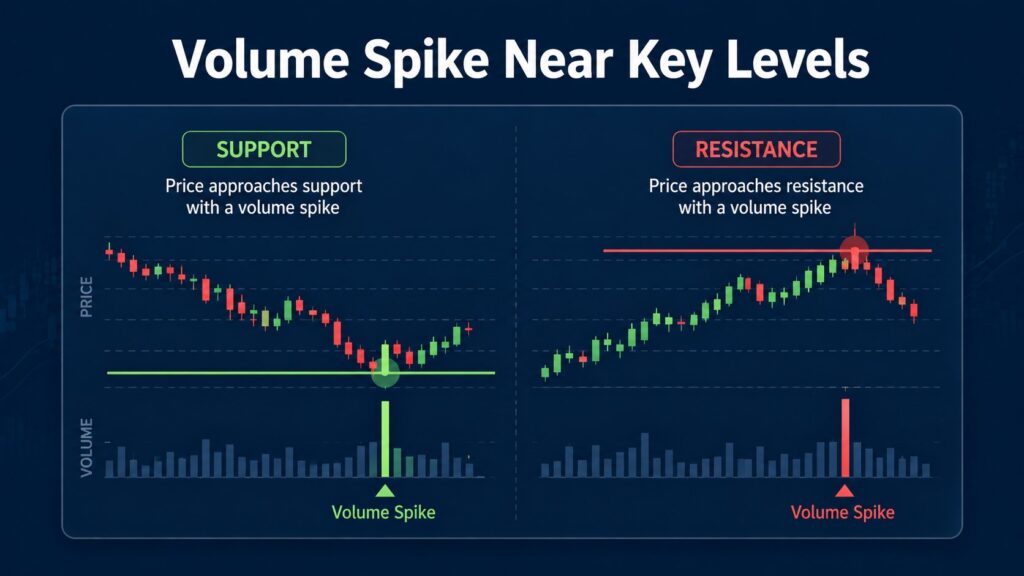
Volume Spikes Near Support or Resistance
Volume spikes near support or resistance are worth watching because they often show emotional decision-making.
Support is an area where buyers have appeared before. Resistance is an area where sellers have appeared before.
When price reaches one of these areas and volume suddenly increases, it often means both sides are active. Buyers and sellers are fighting for control.
But the candle shape gives more context.
A long lower wick near support with high volume may show that sellers pushed price down, but buyers stepped in before the close.
A large red candle breaking below support with high volume may suggest that sellers are taking control.
Near resistance, a long upper wick with heavy volume may show that buyers tried to push price higher, but sellers rejected the move.
This is why volume is not just a number. It is part of the price story.
A Realistic Market Example: NVDA, QQQ, and Bitcoin
Growth stocks like NVDA often move sharply, so volume can be especially helpful.
When reviewing NVDA’s recent daily chart, beginners can often notice a pattern where price pulls back toward a commonly watched moving average, such as the 20-day or 50-day moving average, while volume becomes lighter than during the previous advance.
That kind of pullback can feel uncomfortable because the candles may still be red.
I used to react this way too. I would see three or four red candles, feel that the trend was breaking, and only later realize that volume was actually drying up instead of expanding.
That changed the way I read pullbacks.
Now I try to slow down and ask better questions:
Is the larger trend still rising?
Is price near a previous support area?
Are the red candles showing unusually heavy selling volume?
Is volume drying up as price pulls back?
Are the candles showing lower wicks?
Is QQQ also weak, or is this mostly a single-stock pullback?
If NVDA pulls back on lighter volume while staying above an important support area, the message is different from a sharp drop with expanding volume below support.
The same idea applies to Bitcoin.
Bitcoin often has emotional volume spikes near major price zones. A high-volume candle near resistance may look exciting, but if price closes with a long upper wick, it may also show rejection.
The goal is not to predict the next move perfectly.
The goal is to avoid reacting to one candle without reading the whole chart.
Common Beginner Mistakes When Using Volume
One common mistake is thinking high volume is always bullish.
It is not.
High volume during a breakout can be constructive, but high volume during a breakdown can be a warning sign. High volume near support can also show a battle between buyers and sellers rather than a clean buying signal.
Another mistake is ignoring location.
A volume spike in the middle of a range is less meaningful than a volume spike at a major support or resistance area.
Beginners also compare volume too casually.
TSLA, NVDA, SPY, QQQ, and Bitcoin all trade differently. A volume pattern that looks unusual in one asset may be normal in another.
The biggest mistake is using volume alone.
Volume should support your chart reading, not replace it.
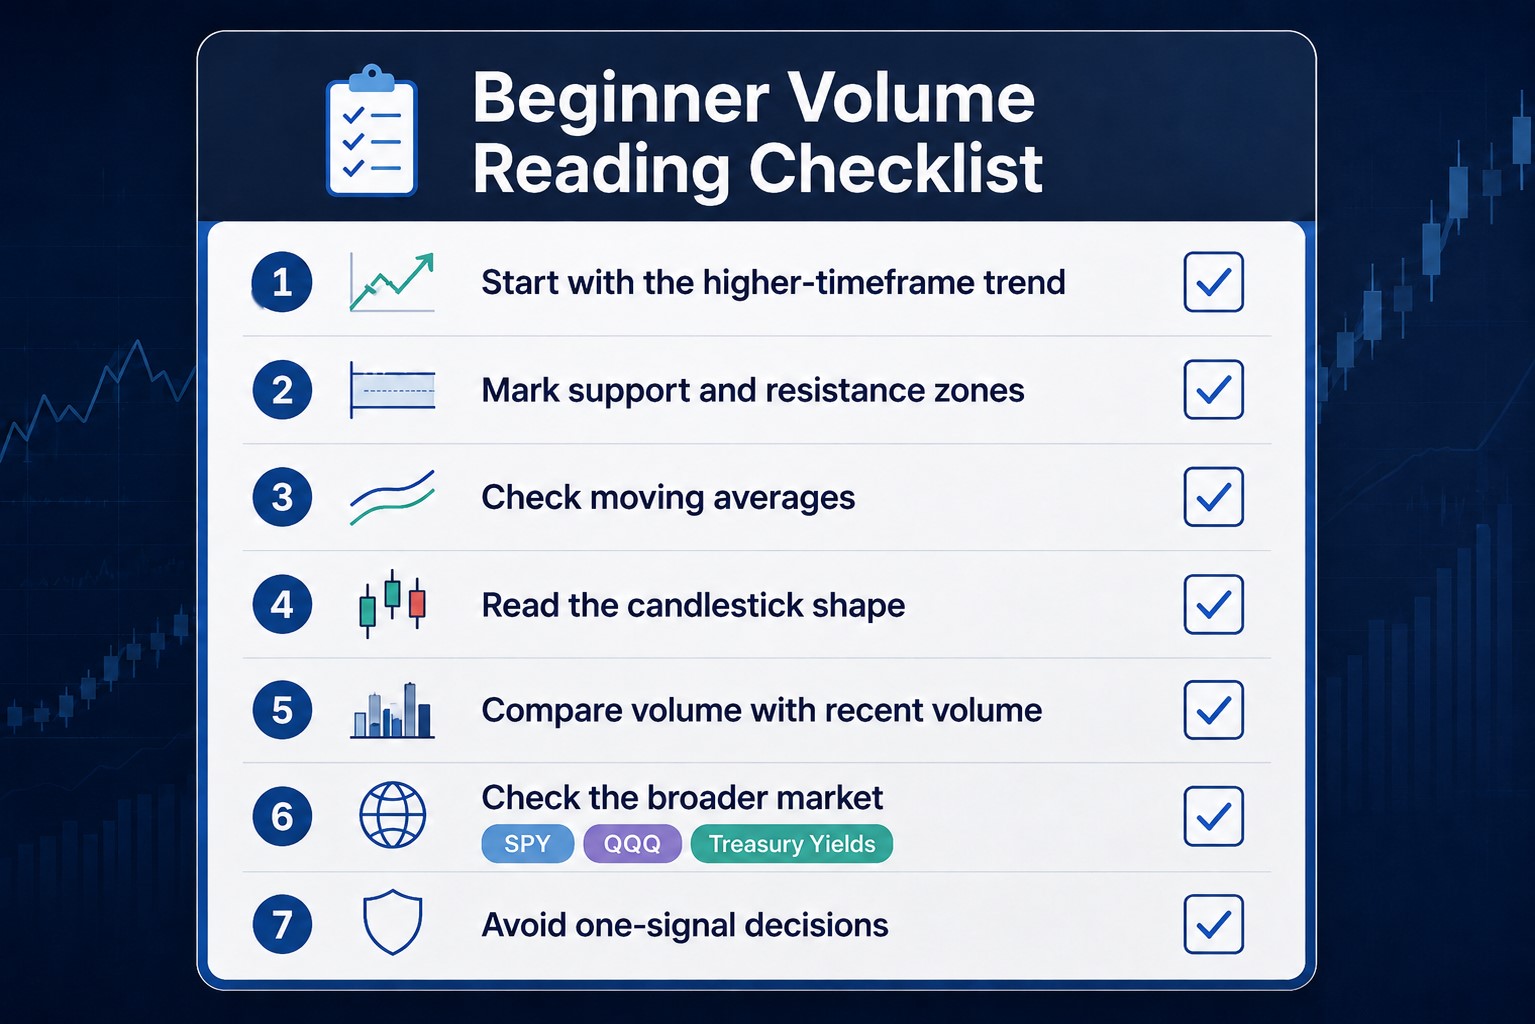
A Practical Chart-Reading Routine for Beginners
Here is a simple routine I like for reading trading volume with price action.
1. Start with the higher-timeframe trend
Use the daily or weekly chart first.
Is price rising, falling, or moving sideways?
Volume signals are easier to understand when you know the larger trend.
2. Mark support and resistance zones
Volume matters more when it appears near important chart levels.
A volume spike near support or resistance usually gives more useful information than a random spike in the middle of a range.
3. Check moving averages
Watch how price behaves near commonly followed moving averages, such as the 20-day, 50-day, or 200-day moving average.
A pullback toward a rising moving average with lighter volume can have a different meaning from a breakdown below a major moving average with heavy volume.
4. Read the candlestick shape
Look at the candle body and wicks.
Did buyers defend the lows?
Did sellers reject the highs?
Did price close near the high or near the low?
Volume becomes more useful when the candle gives context.
5. Compare volume with recent volume
Do not judge volume in isolation.
Ask whether volume is expanding, drying up, or spiking compared with recent activity.
6. Check the broader market
For stocks, compare the chart with SPY, QQQ, sector strength, Treasury yields, and overall market mood.
For Bitcoin, consider risk appetite, liquidity conditions, and major market sentiment.
For broader market context, beginners can also check the U.S. 10-year Treasury yield through FRED, especially when growth stocks or QQQ are reacting strongly.
7. Avoid one-signal decisions
A single volume spike does not create a complete investing thesis.
In my own routine, I try not to let one dramatic candle control my thinking. I want price, volume, trend, and market context to tell a similar story.
If they do not, I slow down.
That habit alone can prevent many beginner mistakes.
Practical Investor Takeaway
Trading volume helps beginners understand participation behind price movement.
A breakout with rising volume may be more convincing than a weak-volume breakout.
A pullback with drying volume may be less concerning than a heavy-volume selloff.
A volume spike near support or resistance may show that buyers and sellers are fighting at an important level.
But volume is not a magic signal.
The better approach is to read volume together with trend direction, support and resistance, candlestick shape, moving averages, broader market conditions, and recent volume behavior.
A simple rule to remember is this:
Do not ask only whether volume is high or low. Ask what volume is saying at that exact chart location.
Final Thoughts
Trading volume for beginners becomes much more useful when it is connected to price action.
Volume does not guarantee that a breakout will continue. It also does not guarantee that a pullback will reverse.
It simply helps you judge whether a price move has stronger or weaker participation behind it.
The best beginner habit is to read charts in layers.
Start with the trend. Mark support and resistance. Check candlestick shape. Look at moving averages. Then read volume. Finally, compare the setup with broader market conditions.
That process will not make every chart easy.
But it can help you avoid one of the most common beginner mistakes: reacting to price movement before understanding the participation behind it.
❓ FAQ
Q1. What does trading volume mean?
Trading volume shows how many shares, contracts, or units were traded during a specific period.
I like to think of it as participation behind price movement, not as a signal that automatically tells you what to do.
Q2. Is high volume always bullish?
No. High volume can be bullish during a breakout, but it can also be bearish during a breakdown. I usually check where the volume appears on the chart before deciding whether it matters.
Q3. What does low volume during a pullback mean?
Low volume during a pullback may suggest that selling pressure is not aggressive.
In my own chart reading, I pay more attention to this when price is still above support or near a rising moving average.
Q4. Why is volume important during a breakout?
A breakout with rising volume may show stronger participation from buyers.
But I still want to see a clean candle close, healthy market conditions, and confirmation from the broader trend.
Q5. What is a good volume signal for beginners?
A useful volume signal for beginners is not just high volume by itself.
I usually look for volume expansion near a breakout, volume drying up during a healthy pullback, or a volume spike near support or resistance.
The key is to read volume together with price action and chart location.
📚 Further Reading
[Macro Analysis] Interest Rates and the Stock Market: A Beginner’s Practical Guide
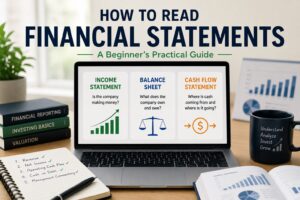
How to Read Financial Statements: A Simple and Powerful Beginner’s Guide
How to Read Financial Statements is one of the most valuable skills a beginner investor…

Fundamental Analysis for Beginner Investors: A Smart Guide to Better Stock Decisions
Fundamental Analysis for Beginner Investors is not about memorizing accounting terms. It is about learning…

How U.S. Treasury Yields Affect Tech Stocks: A Smart and Powerful Beginner’s Guide
How U.S. Treasury Yields Affect Tech Stocks is one of the most important macro relationships…
Disclaimer: This article is for educational purposes only. It is not financial advice or a recommendation to buy or sell any specific stock, ETF, cryptocurrency, or other asset. All investment decisions are your own responsibility.