
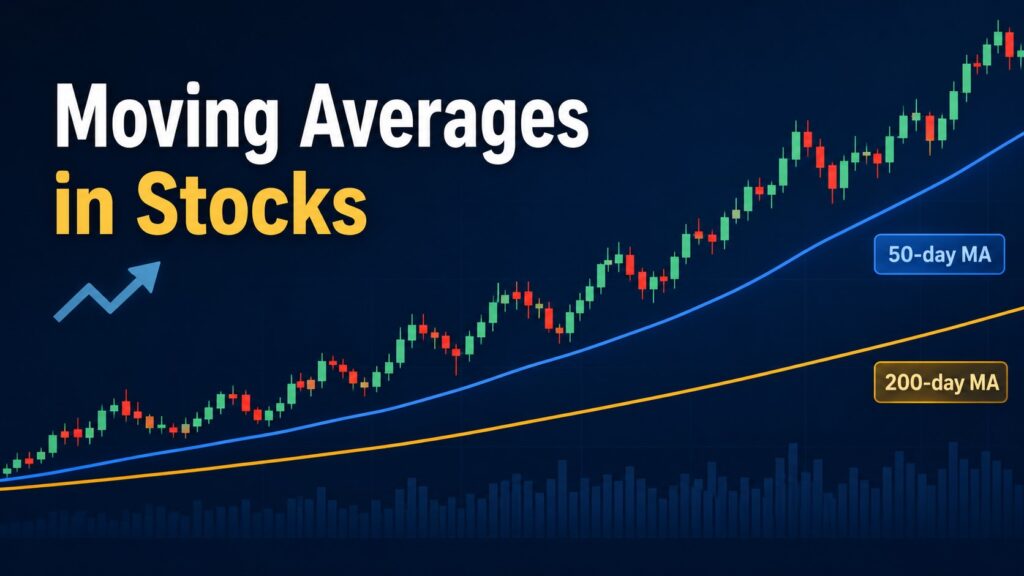
If you have ever opened a stock chart and noticed smooth lines moving across the price, you were probably looking at moving averages.
When I first started reading charts, I misunderstood moving averages as simple “buy signals.” Over time, I learned that they are not prediction tools. They are reference lines that help organize the trend.
Moving averages in stocks are popular because they help investors see the bigger picture without getting distracted by every daily price swing. They do not predict the future, but they can help answer one important question: Is this stock generally trending higher, trending lower, or moving sideways?
For beginner investors, that question is often more valuable than trying to predict the next candle.
Moving averages in stocks are useful because they help beginners see trend direction without reacting to every daily price movement.
When I first started learning technical analysis, I spent far too much time staring at moving averages and far too little time looking at the overall chart. I assumed that if price touched a widely watched moving average, buyers would automatically step in. After watching enough charts, I realized that trend context matters far more than any single indicator.
What Is a Moving Average?
Before using moving averages in stocks, it helps to understand what a moving average actually measures.
A moving average is simply the average closing price of a stock over a specific period.
For example:
- 20-day moving average = average closing price over the last 20 trading days
- 50-day moving average = average closing price over the last 50 trading days
- 200-day moving average = average closing price over the last 200 trading days
As new trading days are added, older data drops out of the calculation. This causes the moving average line to continuously update over time.
A simple way to think about it is this:
The stock price reflects the market’s current emotions, while the moving average helps reveal the broader trend underneath those emotions.
For readers who want a deeper technical definition, you can also review Investopedia’s moving average guide.
Why Moving Averages Matter for Investors
Markets are noisy.
A stock can rise sharply one day and fall the next. If you focus only on daily price movements, it becomes difficult to identify the larger trend.
Moving averages help smooth that noise.
When a stock remains above a rising moving average, it often suggests that buyers continue to support the trend. When a stock trades below a declining moving average, it may indicate that sellers have more control.
This does not automatically create a buy or sell signal. Instead, it provides context.
For example, many investors monitor broad market ETFs such as SPY and QQQ relative to their 50-day and 200-day moving averages. If the overall market falls below key moving averages, even strong individual stocks can become more volatile.
For broader investor education and risk awareness, the SEC Investor Education website is also a useful resource.
The Most Important Moving Averages for Beginners
| Moving Average | Primary Use |
|---|---|
| 20-Day MA | Short-term trend |
| 50-Day MA | Medium-term trend |
| 200-Day MA | Long-term trend |
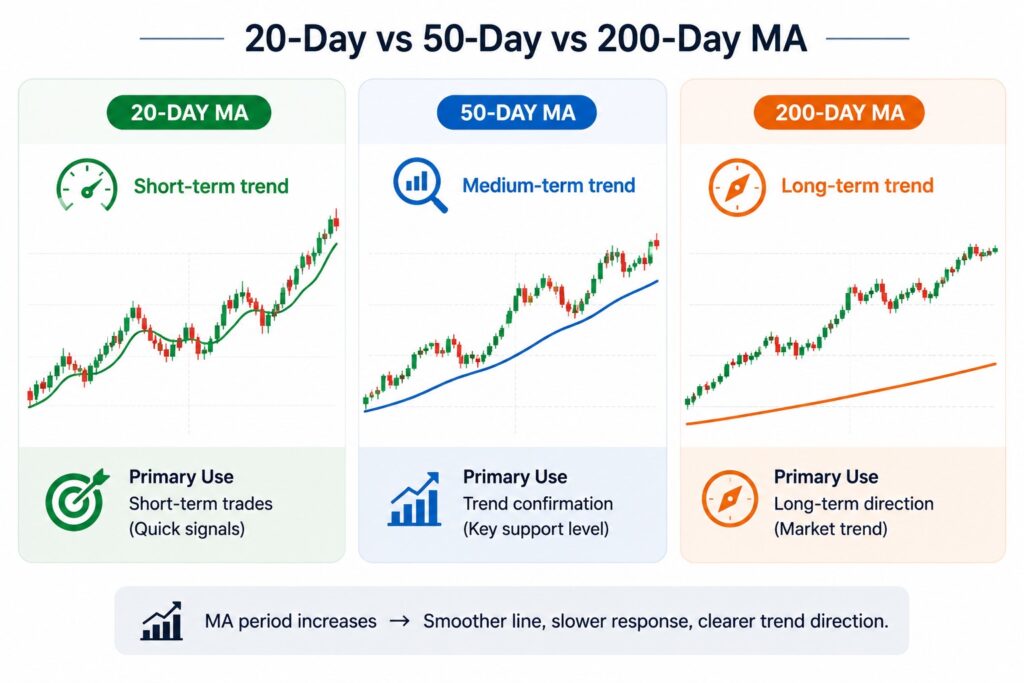
For most beginners, the 50-day and 200-day moving averages are enough.
The 50-day moving average helps identify the medium-term trend, while the 200-day moving average provides a broader view of long-term market direction.
When price trades above both moving averages and both lines are rising, the chart generally looks healthier.
When price remains below both moving averages and both lines are falling, investors often become more cautious.
How I Personally Read Moving Averages
When I first started investing, I treated moving averages like a magic crystal ball.
The moment a stock touched its 200-day moving average, I aggressively bought in, assuming it would bounce.
Sometimes the stock bounced exactly as I expected.
Other times it broke below the moving average and continued falling for weeks.
That experience taught me that a moving average is a guideline, not a guarantee.
Today, I follow a simple process whenever I analyze a chart:
- Start with the weekly or daily chart.
- Identify the larger trend.
- Check where price is relative to the 50-day moving average.
- Review the 200-day moving average.
- Mark key support and resistance levels.
- Check volume.
- Compare the stock with the broader market environment.
This routine helps me avoid making decisions based on a single indicator.
How to Read Price Around a Moving Average
Many beginners focus only on whether price is above or below a moving average.
However, the direction of the moving average is just as important.
A rising moving average often suggests trend strength.
A falling moving average may indicate trend weakness.
A flat moving average can suggest a market that is moving sideways.
This is where context matters.
A stock touching a moving average does not automatically mean it will reverse.
Investors should also evaluate:
- Trend direction
- Volume
- Support and resistance
- Market conditions
- Sector performance
The moving average becomes much more useful when viewed alongside these factors.
Volume is especially important here. If you are new to this concept, our guide on How to Read Stock Volume can help you understand whether a move has real participation behind it.
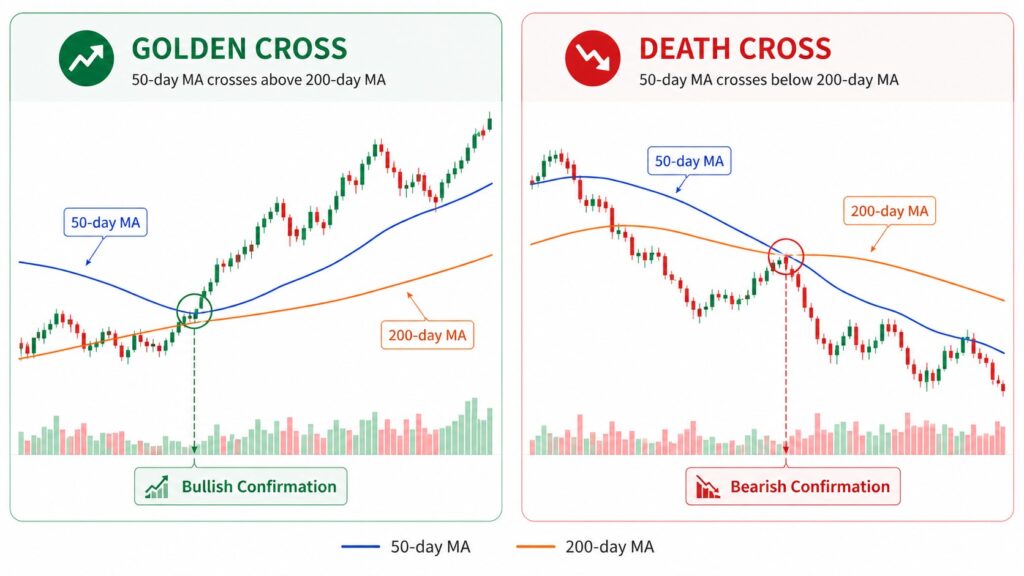
Golden Cross and Death Cross Explained
A Golden Cross occurs when the 50-day moving average rises above the 200-day moving average.
A Death Cross occurs when the 50-day moving average falls below the 200-day moving average.
These signals receive a lot of attention in financial media because they are easy to understand.
However, beginners often misunderstand them.
A Golden Cross does not guarantee future gains.
A Death Cross does not guarantee future losses.
One mistake I often see beginners make is chasing stocks immediately after a Golden Cross appears in the news. By the time the crossover happens, a large part of the move may already have occurred.
I prefer to treat a Golden Cross as confirmation of an existing trend rather than a reason to buy by itself.
In my experience, relying only on a Golden Cross on a 5-minute or 1-hour chart often leads to whipsaws, or false signals. If you are a beginner, I highly recommend starting with the daily or weekly chart first. It reduces noise and helps avoid emotional trading.
💡 My Personal Rule of Thumb
When the broader market, such as the S&P 500, is trading below its 200-day moving average, I automatically become more cautious with position size. It is not a perfect rule, but it helps me avoid treating every short-term rally as the start of a new bull market.
Common Beginner Mistakes
Common mistakes include:
- Buying solely because price touches a moving average
- Chasing Golden Cross headlines
- Ignoring volume
- Focusing only on short-term charts
- Ignoring broader market trends
- Treating moving averages as exact support levels
The biggest lesson is simple.
Moving averages help identify trends, but they do not eliminate risk.
Especially with volatile growth stocks like NVDA or TSLA, the mood can change quickly even when price is still above a moving average. If the Nasdaq weakens, a stock that looked strong yesterday can feel very different within a few trading sessions.
That is why context matters more than any individual indicator.
To read these short-term reactions better, it also helps to understand candle shapes and wicks. You can start with Candlestick Charts for Beginners.
A Simple Moving Average Checklist
Before using moving averages in stocks, ask yourself:
- Is price above or below the 50-day moving average?
- Is price above or below the 200-day moving average?
- Are the moving averages rising or falling?
- Is volume confirming the move?
- Is the broader market strong or weak?
- Am I looking at the full chart or just one indicator?
This checklist will not eliminate mistakes, but it can help reduce emotional decisions.
If you want to practice reading moving averages visually, TradingView’s charting tools can help you compare different timeframes and moving average settings.
Practical Investor Takeaway
The best way to use moving averages in stocks is to treat them as trend-reading tools rather than prediction tools.
For beginners, the 50-day and 200-day moving averages are often the most useful starting points.
The goal is not to predict every move.
The goal is to understand the broader trend and make more informed decisions by combining moving averages with price action, volume, support and resistance, and market context.
Final Thoughts
Looking back, moving averages became much more useful once I stopped treating them as signals and started treating them as context. They did not help me predict the market, but they helped me understand what kind of market I was investing in.
That shift made my chart reading calmer. Instead of asking, “Is this a buy signal?” I started asking, “What is the trend, and is the broader market supporting it?”
That is the real value of moving averages. They reduce noise, show trend direction, and help beginners build a more structured investing process.
A chart is more than one line, and successful investing is rarely about one signal.
❓ FAQ
Q1. What is the best moving average for beginners?
The 50-day and 200-day moving averages are usually the best starting points because they clearly show medium-term and long-term trends.
Q2. Is the 200-day moving average a buy signal?
No. It is a useful reference level, but it should be combined with volume, support and resistance, and broader market conditions.
Q3. What is a Golden Cross?
A Golden Cross occurs when the 50-day moving average moves above the 200-day moving average. Many investors view it as a sign of improving trend strength.
Q4. What is a Death Cross?
A Death Cross occurs when the 50-day moving average falls below the 200-day moving average. It may suggest trend weakness, but false signals can occur.
Q5. Should I use moving averages alone?
No. Moving averages work best when combined with price action, volume, support and resistance, and broader market analysis.
📚 Further Reading
[Macro Analysis] Interest Rates and the Stock Market: A Beginner’s Practical Guide

Fundamental Analysis for Beginner Investors: A Smart Guide to Better Stock Decisions
Fundamental Analysis for Beginner Investors is not about memorizing accounting terms. It is about learning…

How U.S. Treasury Yields Affect Tech Stocks: A Smart and Powerful Beginner’s Guide
How U.S. Treasury Yields Affect Tech Stocks is one of the most important macro relationships…
Inflation and Stock Investing: A Smart and Essential Beginner’s Guide
Inflation and stock investing are closely connected because inflation changes how investors think about earnings,…
Disclaimer: This article is for educational purposes only. It is not financial advice or a recommendation to buy or sell any specific stock, ETF, cryptocurrency, or other asset. All investment decisions are your own responsibility.